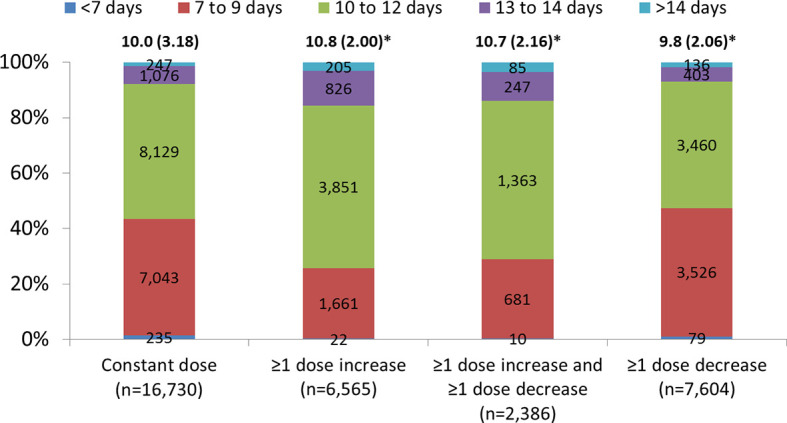
Figure 4.

Length of ovarian stimulation (including cancelled cycles). Data are presented as mean (standard deviation) and number and proportion in each dosing category with no missing cycle length. ≥1 dose increase includes all cycles with at least one dose increase (regardless of any decrease). ≥1 dose decrease includes all cycles with at least one dose decrease (regardless of any dose increase). *p < 0.0001 compared with constant dose. P-values are from models adjusted for differences in age, body mass index, starting dose and other dosing characteristics.
