FIGURE 4.
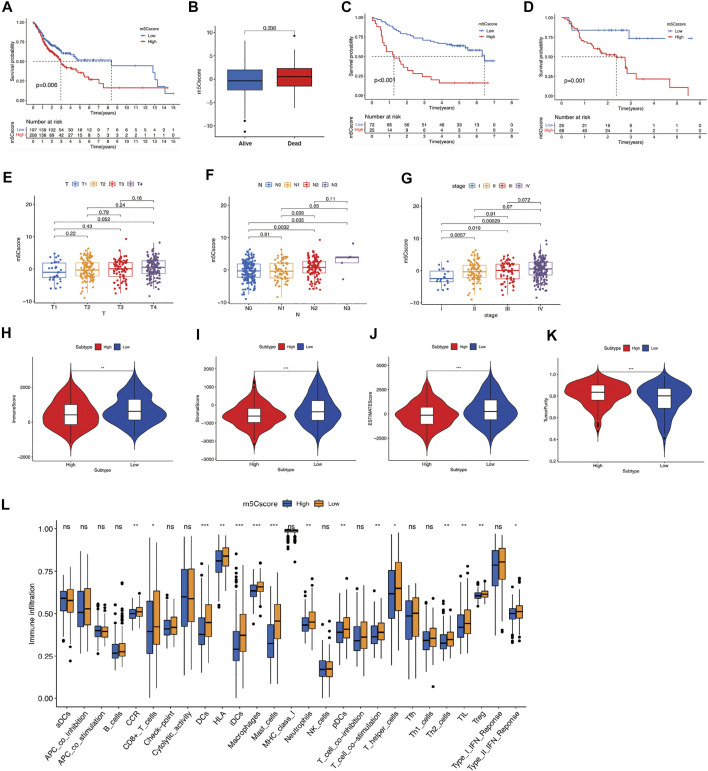
Construction of m5Cscore scoring system. (A) OS analysis for OSCC patients in high- or low-m5Cscore groups. (B) Comparison of m5Cscore in OSCC patients with different prognoses. (C) OS analysis for OSCC patients in high- or low-m5Cscore groups in the validation cohort GSE41613. (D) PFS analysis for OSCC patients in high- or low-m5Cscore groups in GSE65858. (E-G) Comparison of m5Cscore in OSCC patients at different T (E), N (F), and clinical stages (G). (H–K) ESTIMATE analysis for OSCC patients in high- or low-m5Cscore groups, including immune score (H), stromal score (I), ESTIMATE score (J), tumor purity scores (K). (L) The abundance of immune infiltrating cells between high- and low-m5Cscore group by ssGSEA analysis. *p < 0.05; **p < 0.01; ***p < 0.001; ns = not significant. m5C, 5-methylcytosine; OS, overall survival; OSCC, oral squamous cell carcinoma; PFS, progression-free survival.

