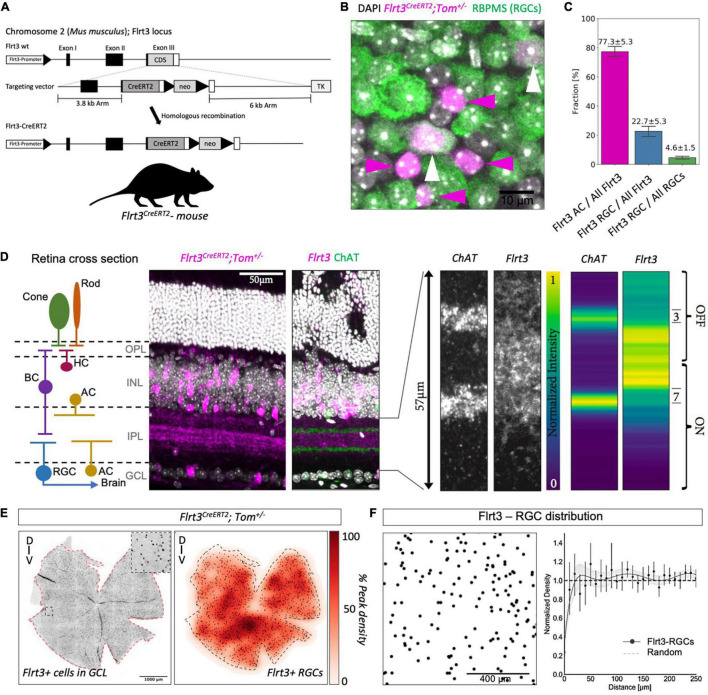
FIGURE 1.
Flrt3 neuronal distribution in the mouse retina. (A) Scheme of the Flrt3-CreERT2 mouse. (B) Immunostaining showing Flrt3+ cells in magenta (tomato), RGCs in green (RBPMS), and the nucleus in white (DAPI). The white arrows indicate FLRT3-RGCs and the magenta arrows FLRT3-amacrine cells. (C) Plot showing the fractions of Flrt3-amacrine (AC) and FLRT3-RGCs in the Flrt3-CreERT2 mouse. Two complete retinas were counted and another three representative regions of interest (ROIs) of another two retinas were included in the quantification. (D) Retina sections of Flrt3-CreERT2;Tom± mouse showing Flrt3 cells in purple and ChAT bands in green. The left panel shows the anatomical structure and cell types of a typical retinal section. The right panel shows a zoom of the IPL region and normalized intensity of ChAT and Flrt3 signals. AC, amacrine cells; BC, bipolar cells; HC, horizontal cells; RGC, retinal ganglion cell; OPL, outer plexiform layer; INL, inner nuclear layer; IPL, inner plexiform layer; GCL, ganglion cell layer. (E) Representative retina density profile (%) of Flrt3-CreERT2;Tom± mice. The left panel shows the distribution of Flrt3+ cells in the ganglion cell layer. The right panel shows the density of Flrt3+ RGCs identified from the left panel. N = 2 retinas from 2 mice (F) Random distribution of Flrt3-RGCs. Left panel: Flrt3-RGC distribution in a ROI of a retina region. Each dot represents a Flrt3+ RGC. Right panel: Density recovery profile of Flrt3+ RGC showing a random distribution. Graph shows Mean value ± SEM. Line represents a 7th order fit of the mean values. Shaded area is the 99% confidence interval. N = 4 retinas from 2 mice.

