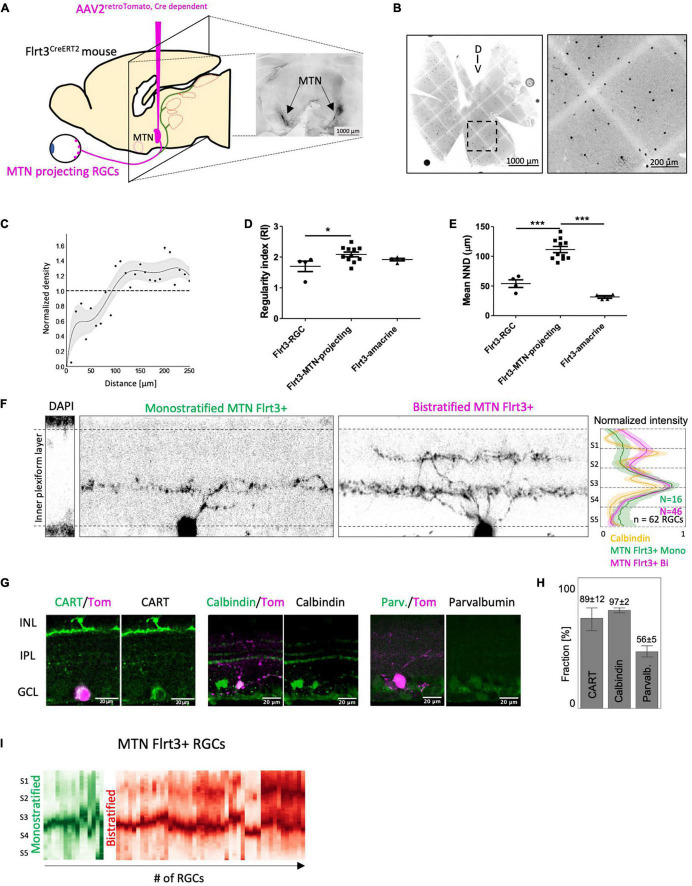
FIGURE 5.
MTN-projecting Flrt3-RGCs are a homogeneous downward ON-DSGC subpopulation. (A) Stereotaxic injection of AAV2retro–cre–Tomato in the MTN of Flrt3-CreERT2 mice to identify Flrt3-RGCs projecting to the MTN. The image on the right shows a representative MTN-injection site after 3 weeks of viral expression. N = 4 mice. (B) Whole mount retina showing the distribution of MTN-projecting Flrt3-RGCs. (C) Normalized density profile of MTN-projecting Flrt3-RGCs. N = 50 ROIs from 11 retinas and 8 animals. (D) Regularity index plot for Flrt3-RGC, Flrt3-MTN-projecting-RGC and Flrt3-amacrine cells. N = 4–11 ROI from different retinas of 3–4 mice (as shown in (B). One-way ANOVA Tukey’s Multiple Comparison Test, *P < 0.05. (E) Average nearest neighbor distance (μm), calculated from same ROIs as in (D). One-way ANOVA Tukey’s Multiple Comparison Test, ***P < 0.001. (F) Orthogonal section through the IPL to visualize the stratification pattern of MTN-projecting Flrt3-RGCs. The right panel shows the average normalized stratification pattern of Calbindin (orange), mono- (green, n = 16 cells from 3 animals, 26%) and bistratified MTN-projecting Flrt3-RGCs (magenta, n = 46 cells from 3 animals, 74%). (G) Immunostaining for CART, Calbindin and Parvalbumin in a retinal sections of MTN injected mice from (A). Tomato signal (magenta) shows MTN-projecting Flrt3-RGCs. (H) Fraction (%) of MTN-projecting Flrt3-RGCs positive for CART, Calbindin and Parvalbumin. N = 60–66 ROIs for each marker from 3 retinas. (I) Normalized stratification patterns of mono- (green) and bistratified (red) MTN-Flrt3-RGCs in the inner plexiform layer, from (F). N = 46 cells from 3 animals.

