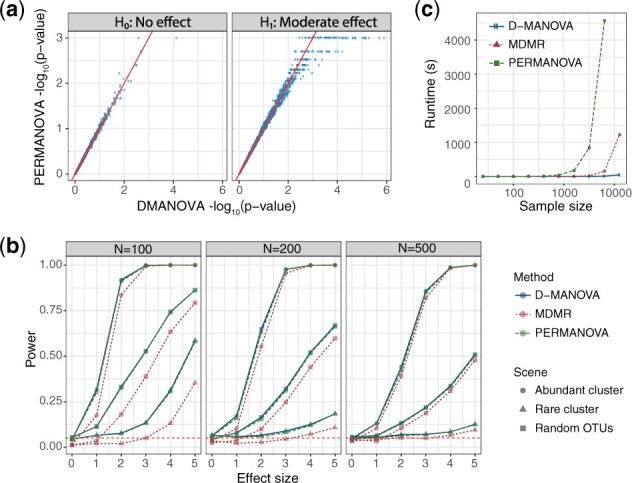
Fig. 1.

Performance comparison of D-MANOVA, MDMR and PERMANOVA (999 permutations) based on simulations. Bray-Curtis distance was used. (a) Scatter plots comparing the P-values of D-MANOVA and PERMANOVA on the log scale under the null (H0) and alternative (H1). (b) Power comparison at sample sizes 100, 200 and 500. Simulation was averaged over 1000 runs. (c) Runtime comparison at varying sample sizes (). Runtimes were averaged over three repetitions. The computation was performed under R v3.3.2 on an iMAC (3.2 GHz Intel Core i5, 32 GB 1600 MHz DDR3, EI Capitan v10.11.5)
