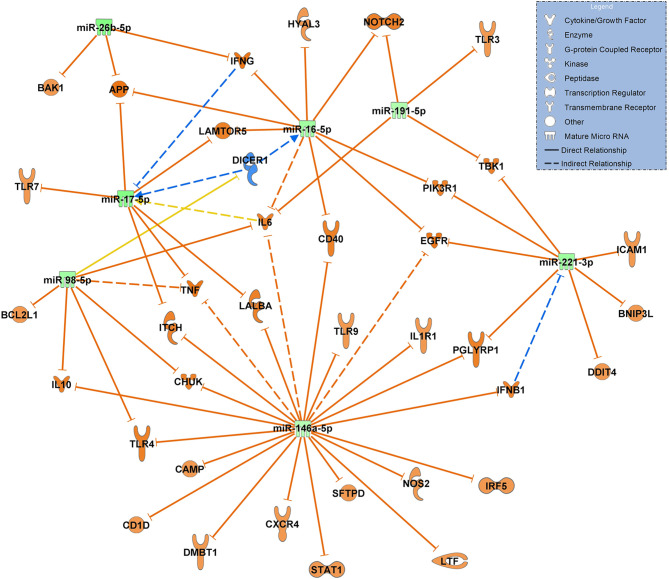
Figure 7.
Changes in miRNA signalling networks during ICU treatment of patients with COVID-19 ARDS based on small RNA sequencing data. miRNA expression values between day 0 (admittance to the ICU, baseline, n=15) and day 14 of ICU treatment (n=13) were compared. All miRNAs in the network were downregulated represented by green colouring and their presumed targets by orange colour. Yellow lines indicate undetermined regulatory effects because the transcripts were targeted by miRNAs with different directions of regulation. Solid lines indicate direct and dashed lines indirect relationships. Data from small RNA sequencing were filtered for antimicrobial response and lung as an organ system and confidence levels were set to experimentally observed. The legend inserted into the graph illustrates the type of target molecules according to the symbols used in the graph.

