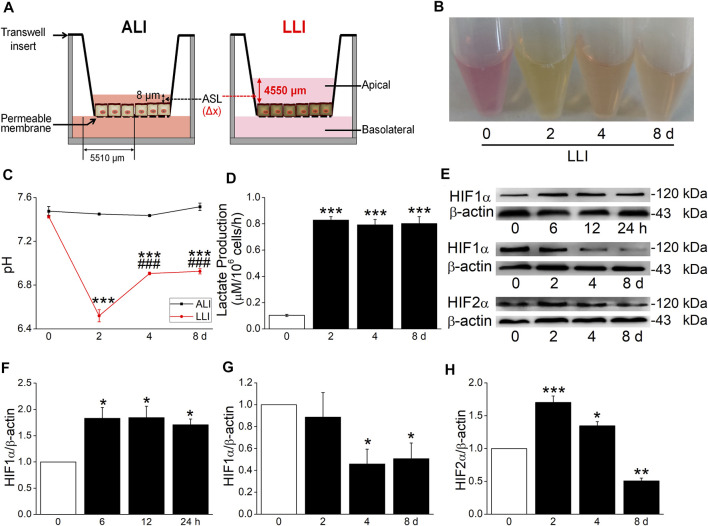
FIGURE 1.
Hypoxia model of MTECs established. (A) A schematic diagram highlighting the distance of oxygen diffusion (Δx) was different in ALI and LLI mode. The thickness of airway surface liquid was about 8 μm in ALI mode and 4550 μm in LLI mode. (B–D) Color, pH, and lactate production of MTEC medium after 0, 2, 4, and 8 days’ LLI culture. *** p < .001, compared with the 0 day group, n = 3–6. One-way ANOVA followed by Bonferroni’s test was used to analyze the difference of the means for significance. (E) Representative graph of hypoxia-inducible factors (HIFs) after different time intervals in LLI mode. (F–H) The statistical data of HIF1α and HIF 2α in the mode of LLI culture. * p < .05, ** p < .01, *** p < .001, compared with ALI mode (0 h/d), n = 3–4. Mann–Whitney U test was used to analyze the difference of the means for significance in (F) and (G), One-way ANOVA followed by Bonferroni’s test was used to analyze the difference of the means for significance in (H).

