FIGURE 2.
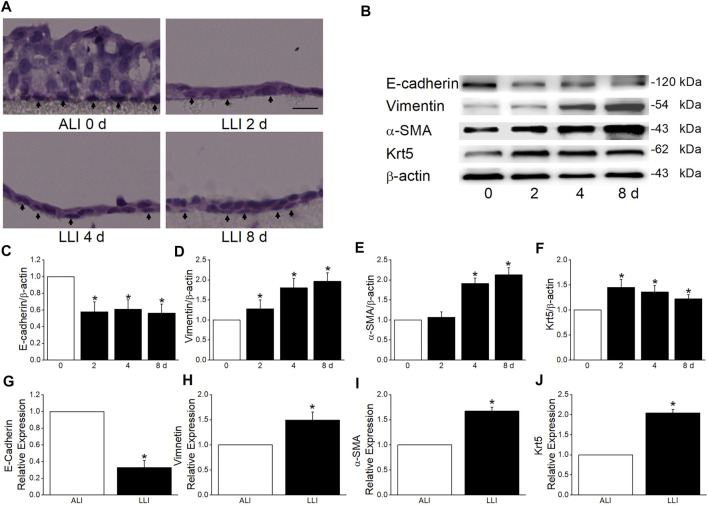
MTECs underwent EMT in the mode of LLI culture. (A) HE staining of MTECs after 0, 2, 4, and 8 days’ (d) LLI culture with the arrowheads indicating the representative cells in each panel. Scale bar = 10 μm. (B) Representative graph of EMT markers (E-cadherin, Vimentin, and α-SMA) and Krt5 after 0, 2, 4, and 8 days’ LLI culture. (C–F) The statistical data of EMT markers and Krt5 in the mode of LLI culture. * p < .05, compared with ALI group (0 days), n = 4. (G–J) Real-time PCR results for EMT marker and Krt5 mRNAs, and β-actin was used as internal reference. * p < .05, compared with ALI (0 days), n = 4–5. Mann–Whitney U test was used to analyze the difference of the means for significance.

