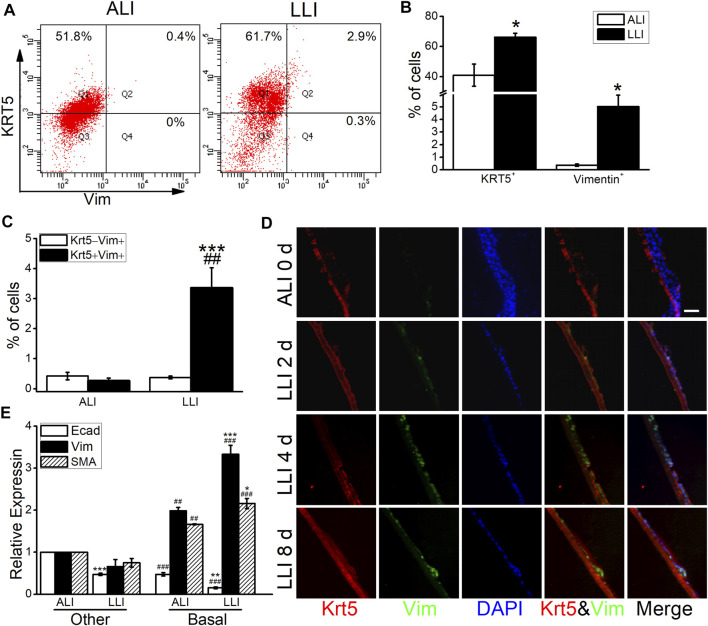
FIGURE 3.
EMT induced by hypoxia was mediated by basal cells. (A) Representative data of flow cytometry in the ALI and LLI groups and the cell ratios were labeled in the corresponding gates. (B) Vimentin and Krt5 positive cell ratios in the mode of LLI culture. * p < .05, compared with ALI group, n = 3–4. (C) Krt5 positive cell ratio in Vimentin expressed cells. *** p < .001, compared with Krt5+Vimentin− cells in LLI group, ## p < .01 compared with KRT5+Vimentin+ cells in ALI group, n = 3–5. (D) Co-expression of Krt5 (red) and Vimentin (green) in MTECs after LLI culture. Scale bar = 20 μm. (E) Heterogeneously expressed EMT markers in different airway epithelial cell types after LLI culture. * p < .05, ** p < .01, *** p < .001, compared with the same cell type, ## p < .01, ### p < .001, compared with the other cells in ALI/LLI group. n = 3. One-way ANOVA followed by Bonferroni’s test was used to analyze the difference of the means for significance.

