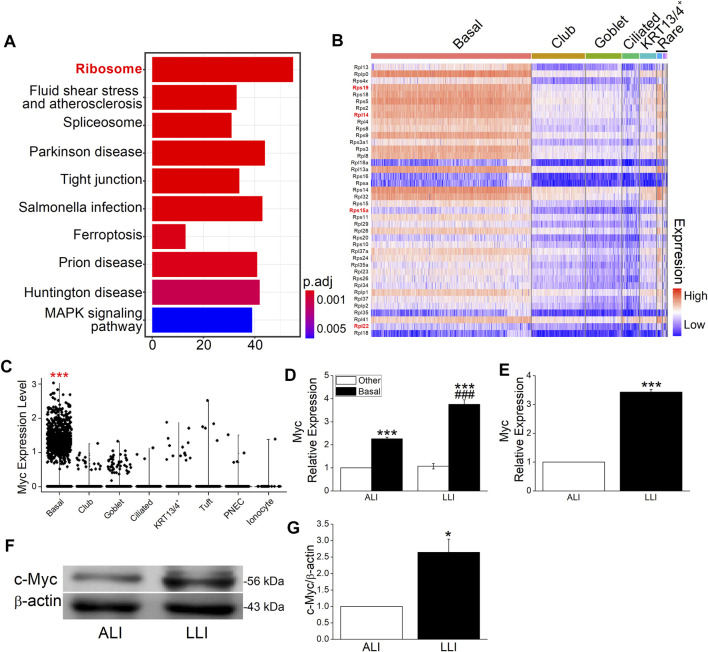
FIGURE 4.
Myc and ribosome proteins were enriched in basal cells. (A) Top 10 enriched pathways of specifically expressed genes in basal cells. Numbers in x-axis represent the genes enriched in the corresponding pathway. P adjust (p. adj) varies from .01 to 0.05. (B) Top 40 ribosome proteins among different cell types. The red and bold font marked genes were closely associated with EMT. (C) Myc in different airway epithelial cells. *** p. adj <.001. (D) Heterogeneously expressed Myc mRNA in different airway epithelial cell types after LLI culture. *** p < .001 compared with the other cells in corresponding group. ### p < .001, compared with ALI group within the same cell type. n = 3. One-way ANOVA followed by Bonferroni’s test was used to analyze the difference of the means for significance. (E) Expression of Myc mRNA in ALI and LLI group. *** p < .001, compared with ALI group, n = 3. Student’s t-test was used to analyze the difference of the means. (F–G) Representative and statistical data of c-Myc. ** p < .01, compared with ALI group, n = 4. Mann–Whitney U test was used to analyze the difference of the means for significance.

