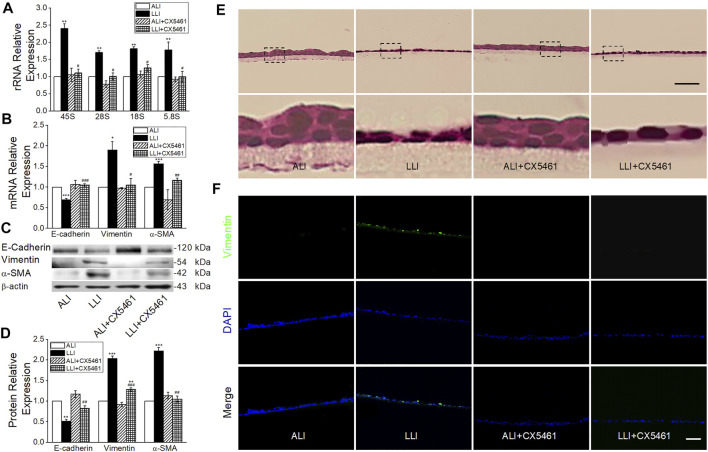
FIGURE 6.
CX-5461 abrogated hypoxia-induced EMT. (A) rRNA expression level after administration of 100 nM CX-5461 in the mode of LLI culture. ** p < .01, compared with ALI group, # p < .05 compared with LLI group, n = 5. Mann–Whitney U test was used to analyze the difference of the means for significance. (B) Expression of E-cadherin, Vimentin, and α-SMA. * p < .05, *** p < .001, compared with ALI group, # p < .05, ## p < .01, ### p < .001, compared with LLI group, n = 3. (C–D) Representative and statistical data of EMT markers. ** p < .01, *** p < .001 compared with ALI group, ## p < .01, ### p < .001, compared with LLI group, n = 3–4. One-way ANOVA followed by Bonferroni’s test was used to analyze the difference of the means for significance. (E) HE staining. The nether line of images was enlarged from the upper original image. (F) Immunofluorescence of Vimentin (green). The nucleus was stained with DAPI (blue). Scale bar = 50 μm.

