Figure 11.

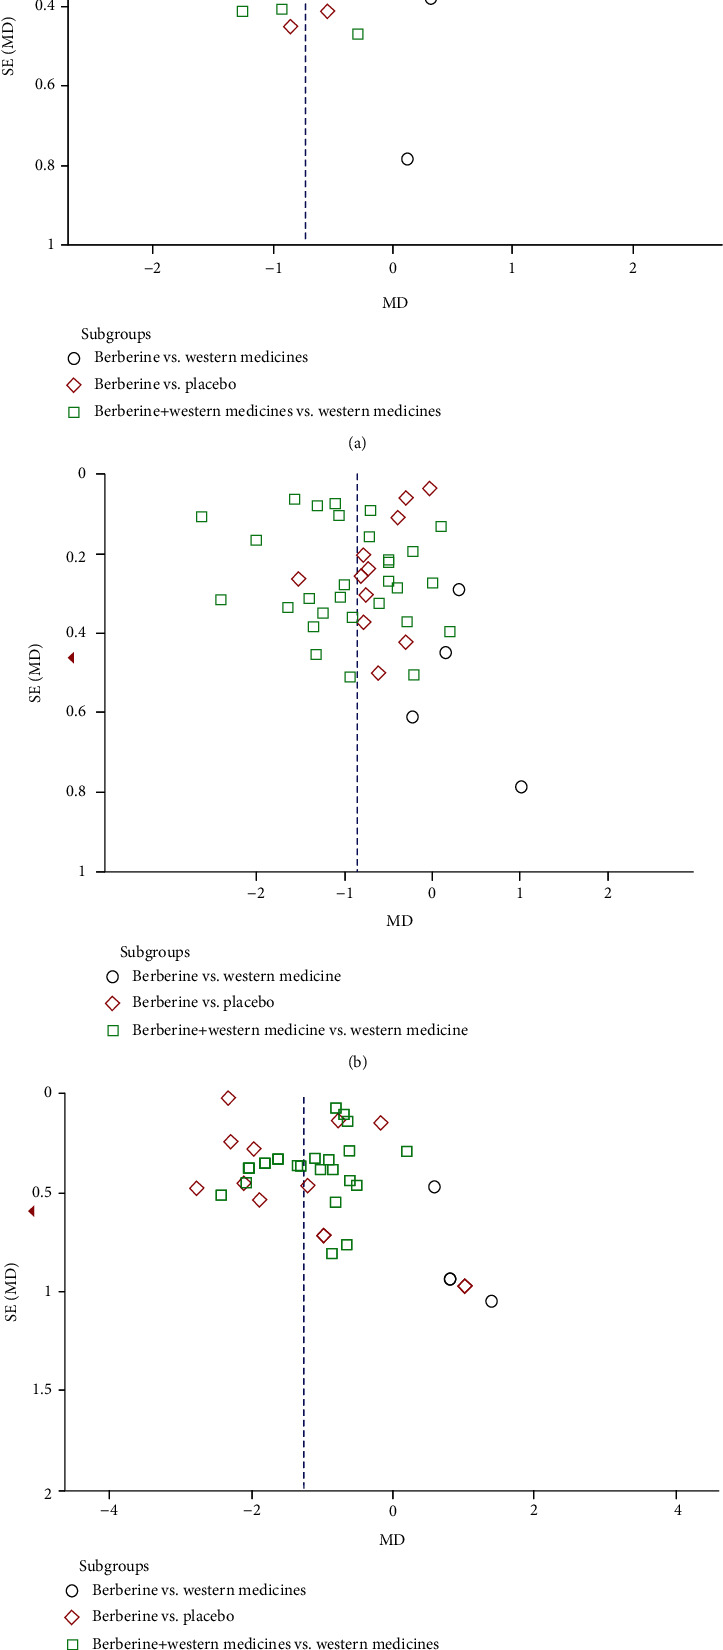
Funnel plots of comparison. A funnel plot was used to evaluate potential publication bias. Comparison in HbA1c, FPG, and 2hPG was conducted by funnel plots.

Funnel plots of comparison. A funnel plot was used to evaluate potential publication bias. Comparison in HbA1c, FPG, and 2hPG was conducted by funnel plots.