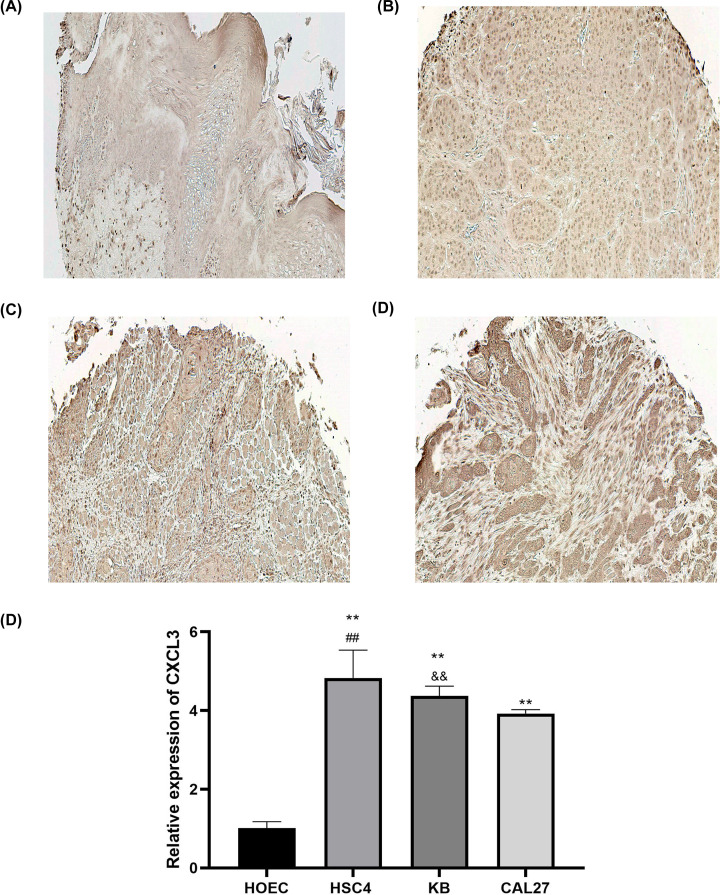
Figure 6. CXCL3 expression in human HNSCC tissues and cell lines.
(A) Representative image from normal head and neck tissue with weak staining intensity of CXCL3. (B–D) Representative images from Stage I, II, and III HNSCC tissue samples exhibiting strong staining intensity of CXCL3. (E) CXCL3 mRNA expression levels in HOEC, HSC4, KB, and CAL27 by qRT-PCR. **P<0.01 vs. HOEC cells; ##P<0.01 vs. KB and CAL27 cells; &&P<0.01 vs. CAL27 cells; HNSCC, head and neck squamous cell carcinoma.

