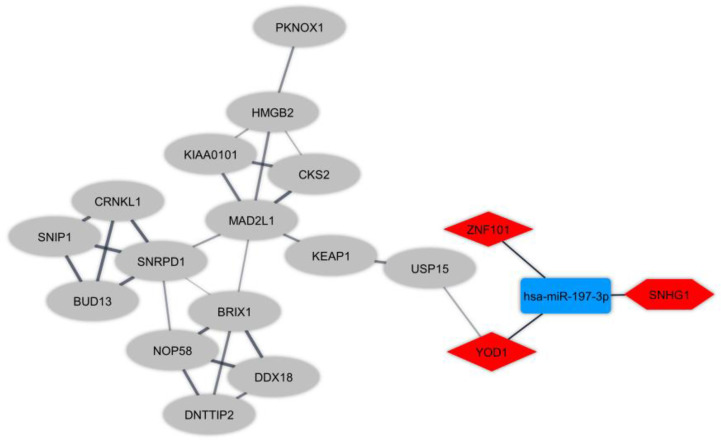
Figure 3.
The long non-coding RNA-associated competing endogenous RNA (ceRNA) axes in T-cell in Multiple sclerosis. The red and blue nodes represent the upregulation and downregulation, respectively. The hexagon nodes and the round rectangle nodes represent the lncRNA and miRNA, respectively. The diamond nodes represent miRNAs targeted mRNAs. The ellipse nodes represent downstream connected mRNAs.

