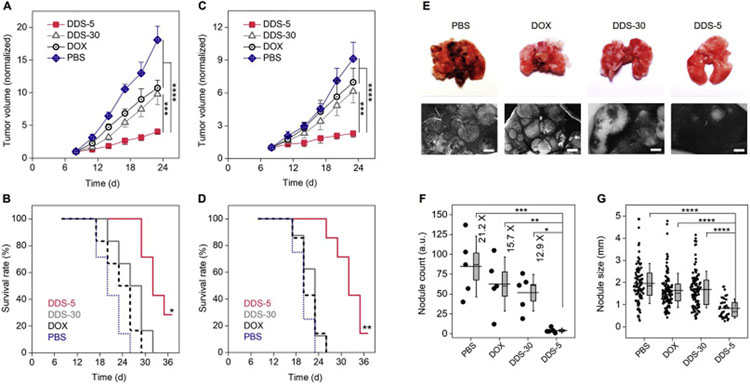
Fig. 8.
Improved antitumor efficacy of renal clearable DDS among primary and metastatic tumor models. (A-D) Normalized tumor growth curves and survival rates of the MCF-7 xenograft (A, B) and 4T1 primary (C, D) tumors, respectively, during the successive treatments. For A and C, ***P < .0005, ****P < .0001 (One-Way ANOVA, n = 5). For B, *indicates P < .05, < 0.005, < 0.0005 for DDS-5 versus DDS-30, free DOX and PBS, respectively; For D, **indicates P < .001 for DDS-5 versus DDS-30 and free DOX, P < .0005 for DDS-5 versus PBS, respectively (Kaplan-Meier, n = 6–8). (E) Images of mice lungs after the successive treatments (day-23). Scale bar, 1 mm. (F) Nodule counts of the metastatic lung tumors after treatments. *P < .05, **P < .01, ***P < .001, ****P < .0001. Box indicates median and s.e.m. (G) Lung tumor nodule sizes. ****P < .0001. Box indicates median and 25–75% interquartile range (n = 5). Adapted from ref. [119,151].

