
Figure 1. Inflammatory pain suppresses the PL-PFC response to acute noxious stimuli.
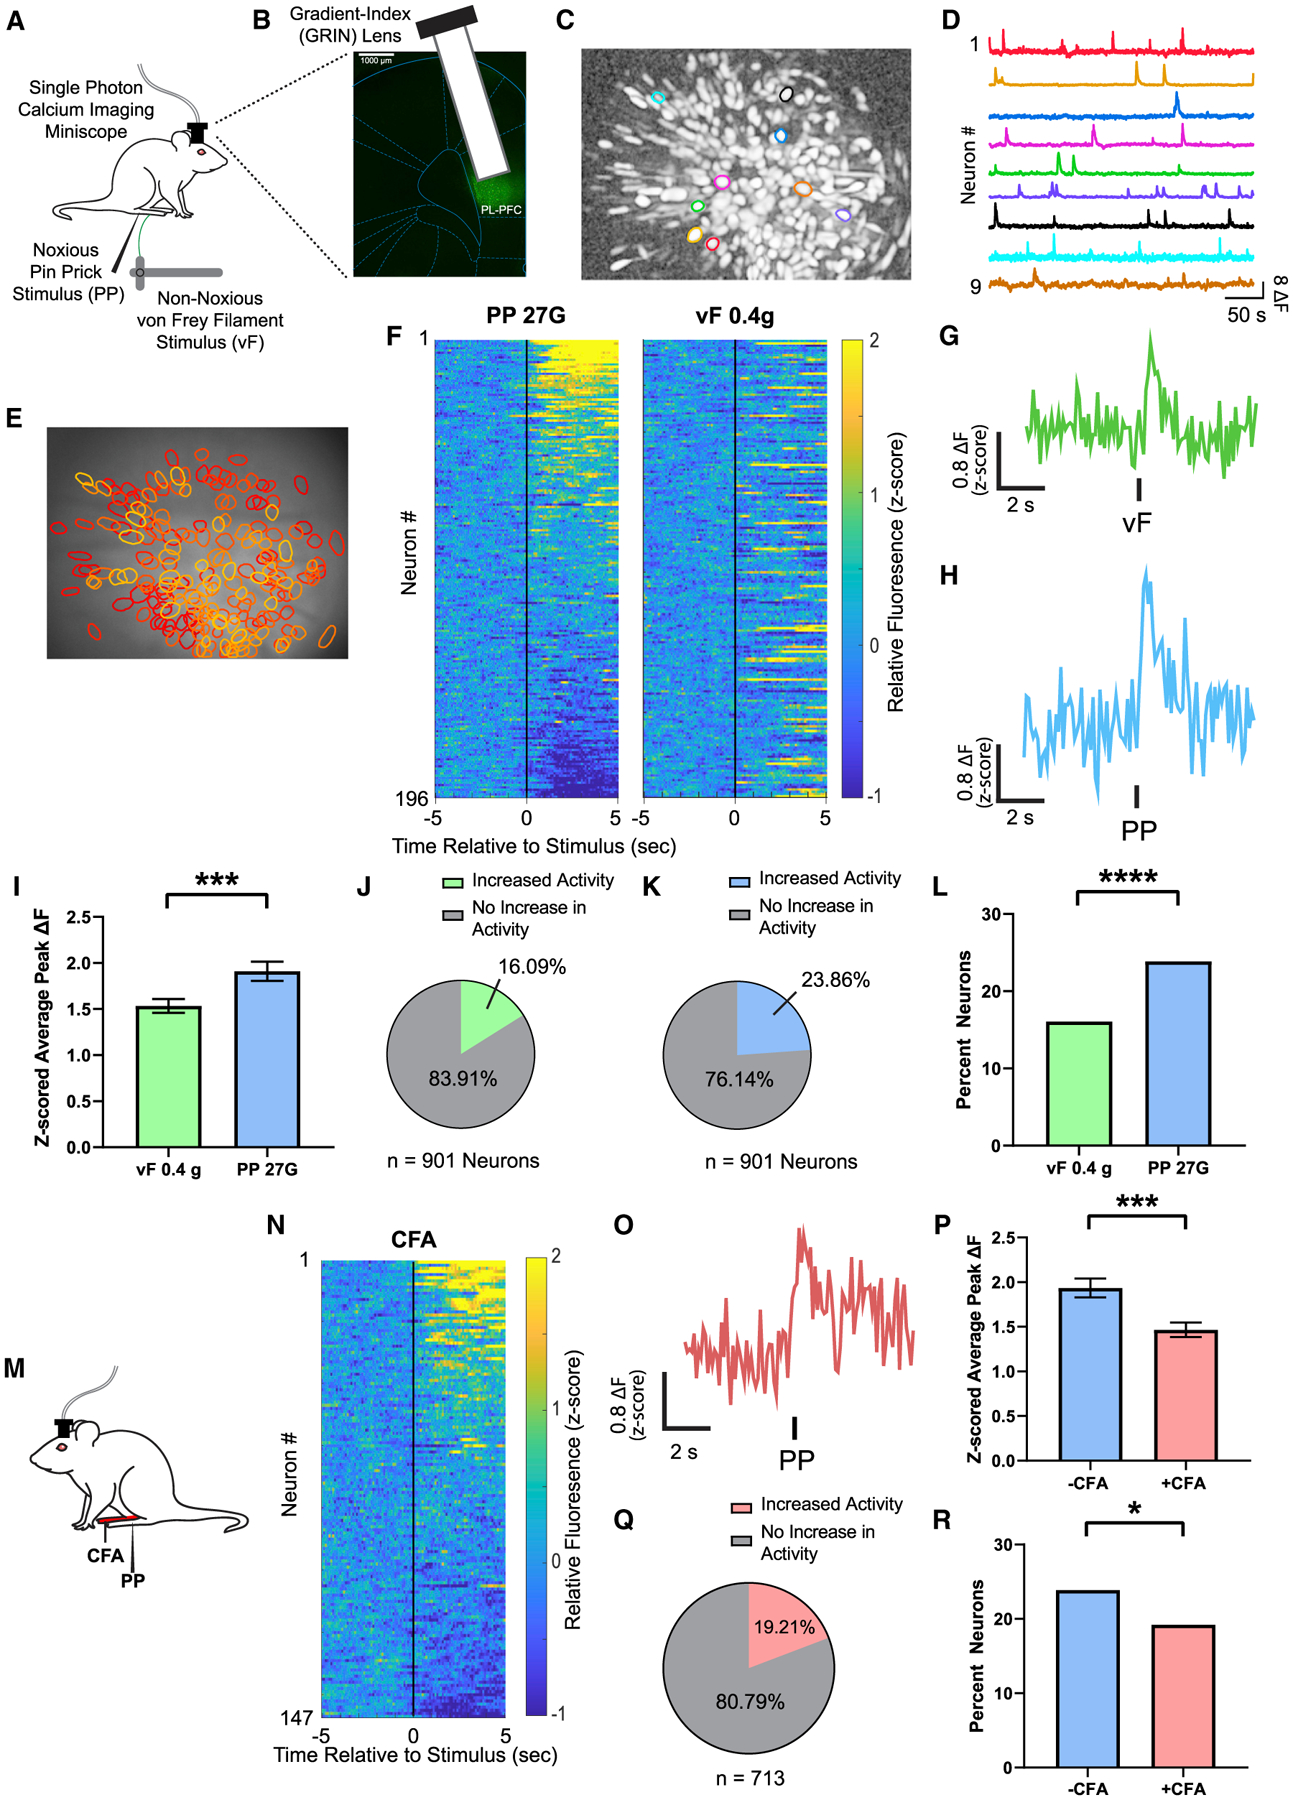
(A) Schematic of calcium imaging experiments.
(B) Gradient-index (GRIN) lens placement and GCaMP6f expression. Scale bar, 1000 μm.
(C and D) Map of example identified contours in maximum projection image after motion correction and neural enhancement (C) with corresponding activity traces (D).
(E) Map of active PL-PFC neurons with overlaid contours over imaging field of view.
(F) Mean Ca2+ response (Z scored relative fluorescence) across all trials for all PL-PFC neurons imaged during a single session (n = 196 neurons) from the same rat. Neurons are aligned from high to low Ca2+ responses after acute noxious (PP) stimulus. Individual neuron identifications between PP and acute non-noxious (vF) stimulation are consistent across trial rows.
(G) Representative trace of analysis-derived activity of a single neuron during vF during a single session. See STAR Methods.
(H) Representative trace of analysis-derived activity of a single neuron during PP during a single session. See STAR Methods.
(I) Neurons in the PL-PFC show increased activity after administration of an acute pain stimulus. n = 901 neurons (9 rats); p = 0.0002, paired Student’s t test. See STAR Methods.
(J) A total of 16.09% neurons in the PL-PFC, n = 901 neurons in 9 rats, showed a change in activity in response to vF. See STAR Methods.
(K) A total of 23.86% neurons in the PL-PFC, n = 901 neurons in 9 rats, showed a change in activity in response to PP. See STAR Methods.
(L) More PL-PFC neurons responded to PP than vF. p < 0.0001, Fisher’s exact test. See STAR Methods.
(M) Schematic of the CFA model. Peripheral stimulation occurred on the paw contralateral to CFA injection.
(N) Mean Ca2+ response (Z scored relative fluorescence) across all trials for all PL-PFC neurons imaged during a single session (n = 147 neurons) from the same CFA-treated rat. Neurons are aligned from high to low Ca2+ responses after PP.
(O) A representative trace of analysis-derived activity of a single neuron during PP during a single session of a CFA-treated rat.
(P) After CFA administration, neurons in the PL-PFC showed a decrease in peak Ca2+ fluorescence in response to noxious stimulations. −CFA, n = 901 neurons (9 rats); +CFA, n = 713 neurons (9 rats); p = 0.0004, unpaired Student’s t test.
(Q) A total of 19.21% neurons in the PL-PFC, n = 713 neurons in 9 rats, had a change in activity in response to PP after CFA.
(R) Inflammatory pain decreased the number of neurons in the PL-PFC that responded to noxious stimuli. p = 0.0249, Fisher’s exact test.
Data represented as mean ± SEM.