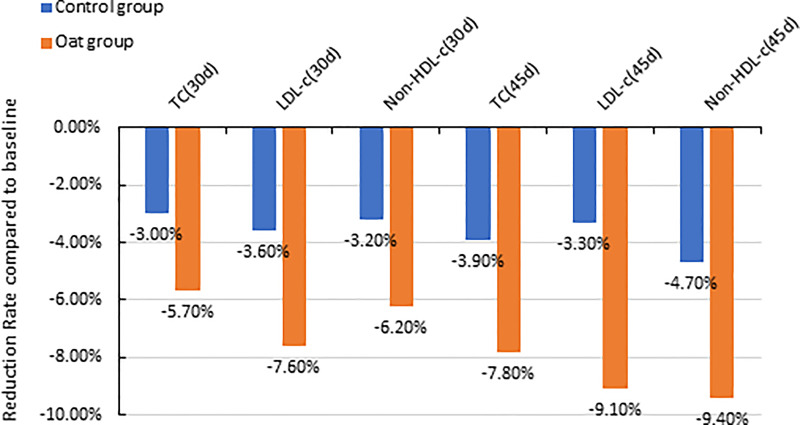
Figure 1.
Barchart of percentage reduction of TC, LDL-c, and non-HDL-C at Day 30 and Day 45 compared with baseline (Day 0) for both oat (n = 94) and control (n = 93) groups (TC, total cholesterol; LDL-c, low-density lipoprotein cholesterol; non-HDL-C, Non-high-density lipoprotein cholesterol; d, Day).

