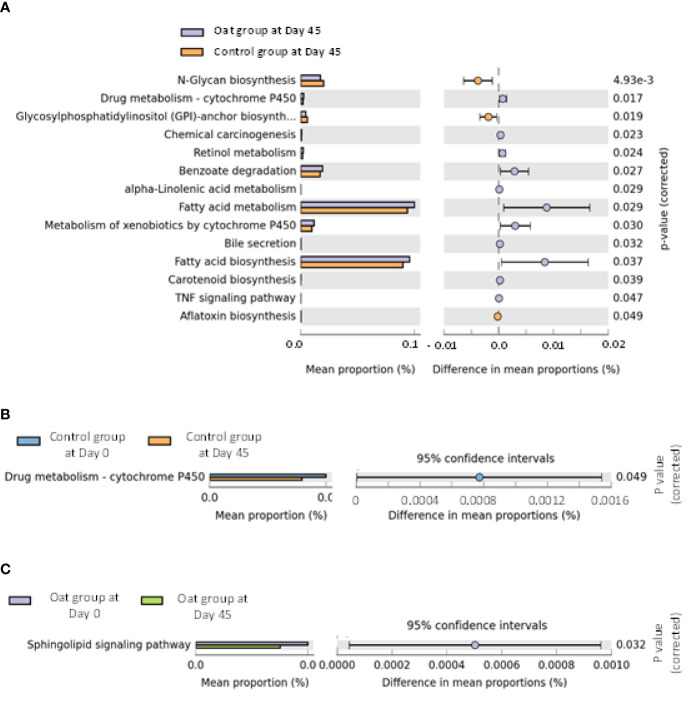
Figure 3.
(A) Barchart of metabolic pathways which are significantly related to oat consumption between oat and control groups (White’s nonparametric t-test after FDR was used for comparison between groups; analysis was performed on STAMP software and referenced to KEGG data). (B) Barchart of significantly different pathways within control group at days 0 and 45 in two sites (White’s nonparametric t-test after FDR was used for comparison within group; analysis was performed on STAMP software and referenced to KEGG data). (C) Barchart of significantly different pathways within oat group at days 0 and 45 in two sites (White’s nonparametric t-test after FDR was used for comparison within group; analysis was performed on STAMP software and referenced to KEGG data).

