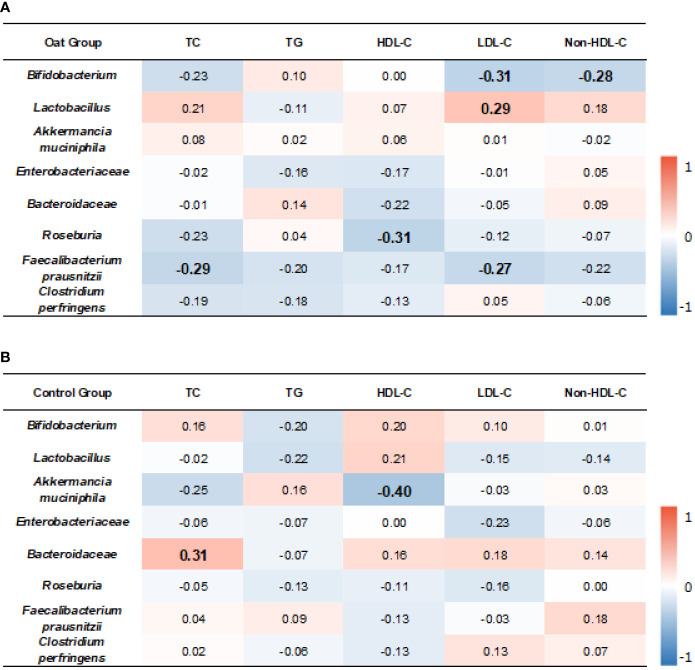
Figure 5.
Heatmap of correlation coefficients between bacterium and blood lipid parameters in oat group (A) and in control (B) group. Correlation values in bold indicate significance. TC, total cholesterol; TG, total triglyceride; HDL-C, high-density lipoprotein cholesterol; LDL, low-density lipoprotein cholesterol; non-HDL-C, non-high-density lipoprotein cholesterol. Correlation analysis was based on Spearman correlation method.

