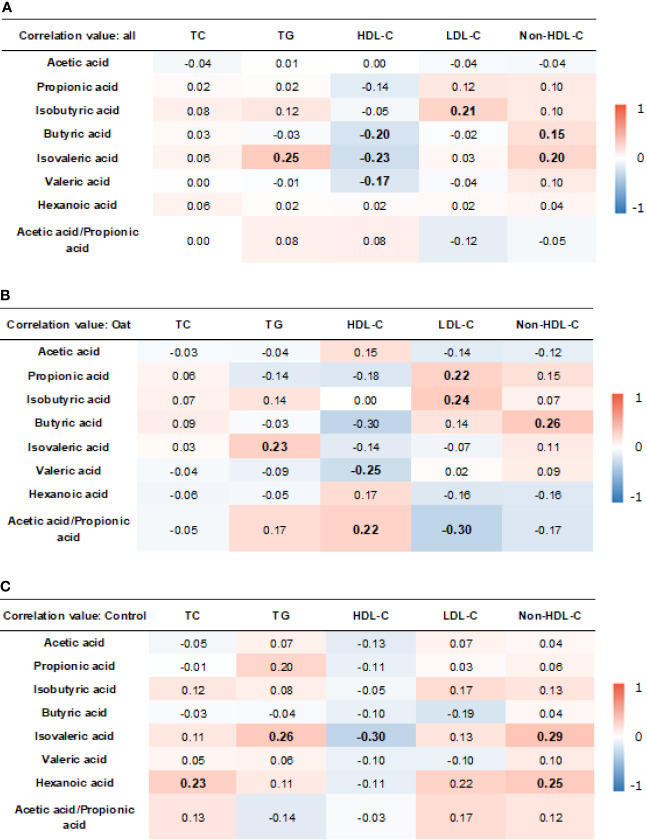
Figure 7.
Heatmap of correlation coefficients between blood lipid parameters and SCFAs in all participants (A), oat group (B), and in control (C) group. Correlation values in bold indicate significance. TC, total cholesterol; TG, total triglyceride; HDL-c, high-density lipoprotein cholesterol; LDL, low-density lipoprotein cholesterol; non-HDL-c, non-high-density lipoprotein cholesterol. Correlation analysis was based on Pearson correlation method.

