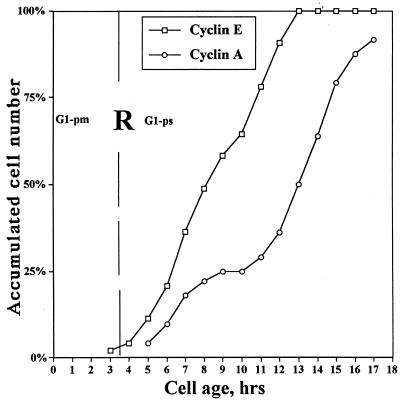
FIG. 4.
Temporal relationship between (i) cyclin E expression and (ii) passage through R and entry into S. Continuously cycling, TLV-analyzed HDF were double immunofluorescence stained for cyclins E and A. The cumulative number of cells positive for cyclin E or A immunofluorescence was plotted against cell age (time elapsed after the last mitosis). Cyclin A positivity is used as a marker for S phase. The approximate time of R is shown as a vertical dashed line. Curves were smoothed according to the three-point moving-average method. Percentages refer to percentages of total cyclin E- and A-positive cells, respectively.

