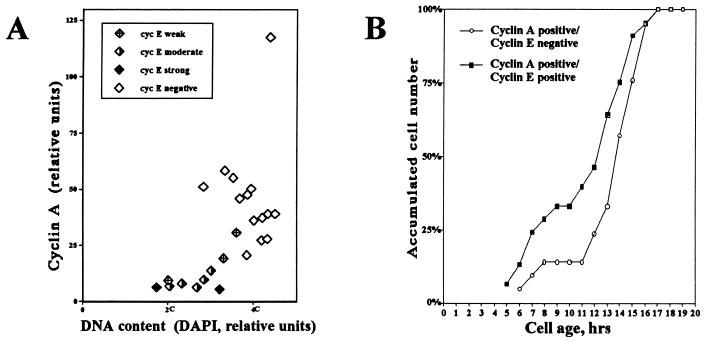
FIG. 6.
Cyclin E is downregulated during the first half of S phase. Continuously cycling HDF were double immunofluorescence stained for cyclins E and A. (A) The relative cyclin A level and cyclin E positivity were plotted against DNA content, as determined by intensity of DAPI fluorescence, for individual cells. Cyclin E positivity is subdivided into four intensity classes, ranging from strong to negative. The 2C and 4C DNA content levels are estimates based on minimal and maximal DAPI staining intensities, respectively. (B) Continuously cycling, TLV-analyzed HDF were double immunofluorescence stained for both cyclins E and A. Cyclin A-positive cells were divided into two classes: those that were also positive for cyclin E and those in which cyclin E had been downregulated (cyclin E-negative cells). Both classes of cyclin A-positive cells were plotted as a function of relative cell age (time elapsed after the last mitosis). Cyclin A positivity is used as a marker for entry into S phase. The curve corresponding to cyclin E-negative cells is shifted by 1 to 4 h compared to that corresponding to cyclin E-positive cells, suggesting that cyclin E downregulation occurs shortly after entry into S phase. Curves were smoothed according to the three-point moving-average method. Percentages refer to the percentage of the total of each class.

