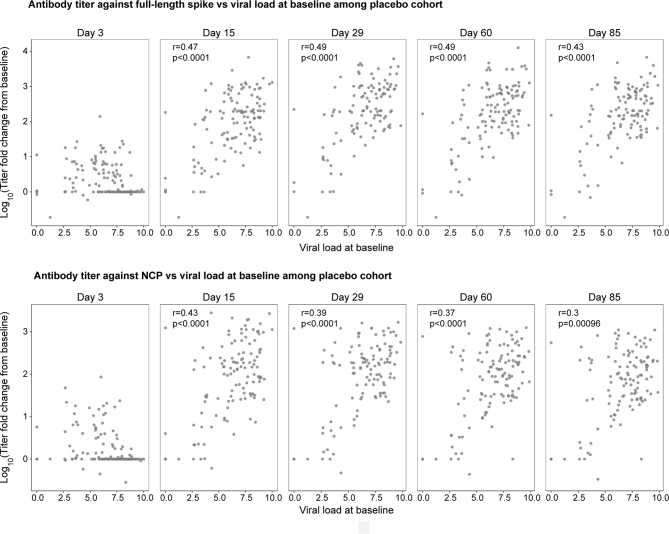
Figure 4.
The natural history relationship between viral load at baseline (x-axis) and the fold change in antibody titer against the full-length spike (top panel) and NCP (bottom panel) from baseline to day 3, 15, 29, 60, and 85 in the placebo cohort. 42% and 54% of patients were sero-negative at both baseline and day 3 for full-length spike and NCP, respectively. r is the spearman correlation between viral load and log of titer fold change from baseline; p is the p-value associated with spearman correlation test.

