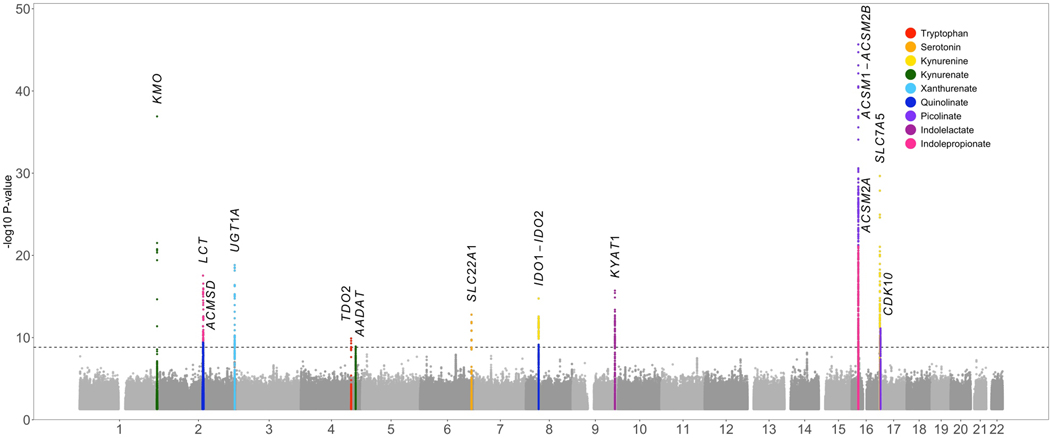
Figure 3. Manhattan plot for GWAS of circulating tryptophan metabolite levels.
Meta-analyses of GWAS in up to 9,290 individuals from HCHS/SOL, ARIC, and FHS identified 13 loci for 9 tryptophan metabolites (color indicated in inset). The significant P-value threshold is 4.5×10⁻⁹ (indicated by a dash line).

