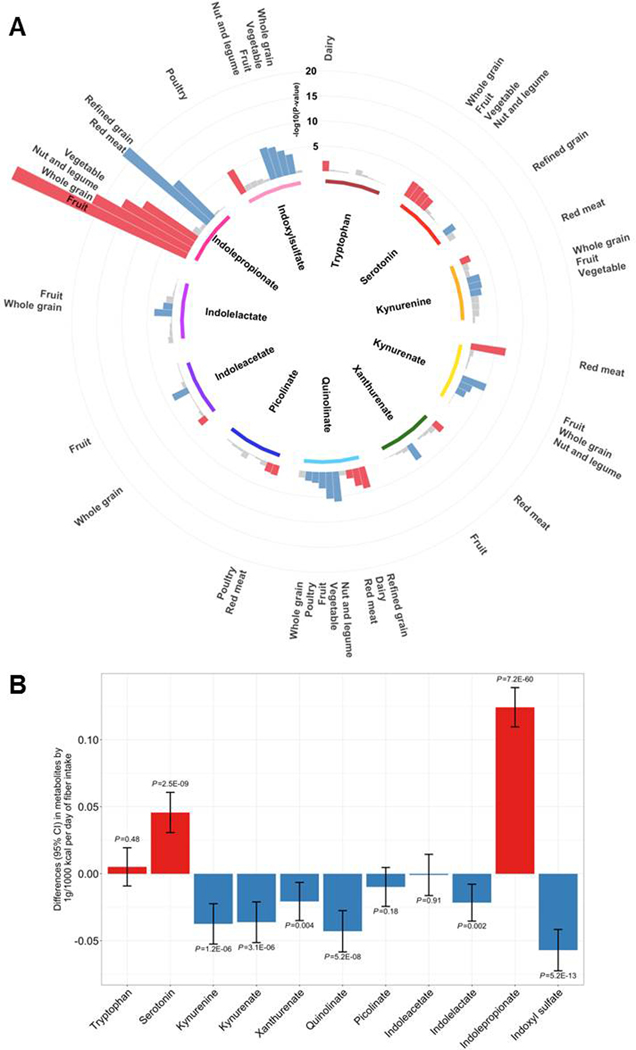
Figure 4. Dietary intake and serum tryptophan metabolite levels.
(A) Polar plot for associations of 10 major food groups with serum tryptophan metabolites in the HCHS/SOL. Red: positive associations (FDR<0.05); Blue, inverse associations (FDR<0.05). (B) Differences (95% CI) in serum tryptophan metabolite levels (inverse normal transformed) associated with 1g/1000Kcal per day of dietary fiber intake in the HCHS/SOL.

