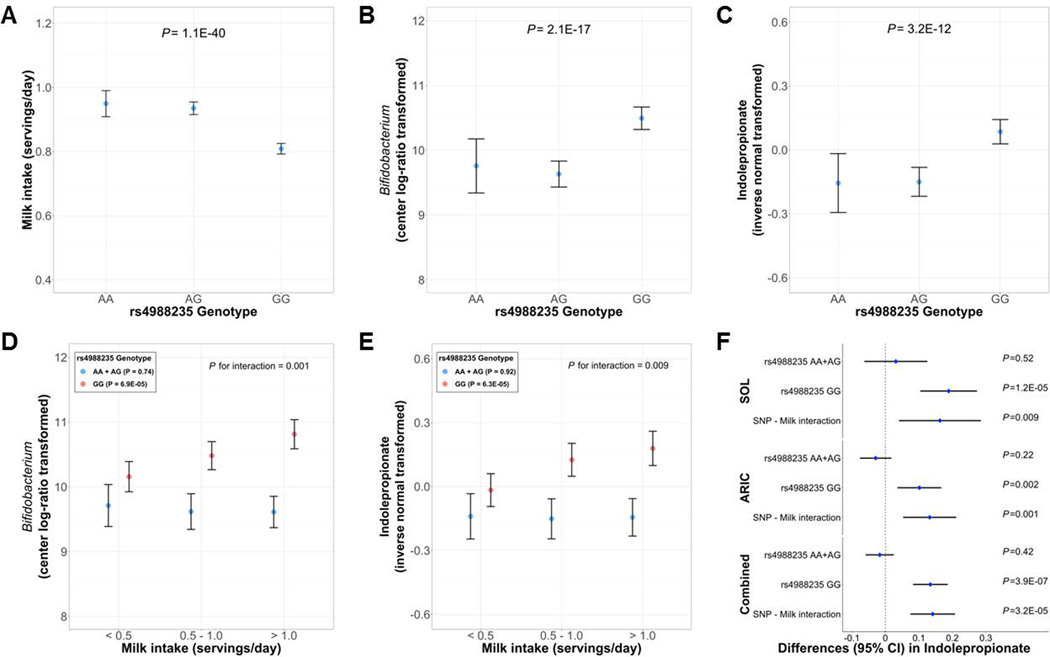
Figure 6. Host LCT genotype, milk intake, gut Bifidobacterium and serum indolepropionate.
(A) Adjusted means and 95% confidence intervals (CIs) of milk intake (servings/day) according to LCT-rs49883235 genotypes in the HCHS/SOL. (B) Adjusted means and 95% CIs of gut Bifidobacterium abundance (center log-ratio transformed) according to LCT-rs49883235 genotypes in the HCHS/SOL. (C) Adjusted means and 95% CIs of serum indolepropnate levels (inverse normal transformed) according to LCT-rs49883235 genotypes in the HCHS/SOL. (D) Adjusted means and 95% CIs of gut Bifidobacterium abundance (center log-ratio transformed) according to milk intake stratified by the LCT-rs49883235 genotype in the HCHS/SOL. (E) Adjusted means and 95% CIs of serum indolepropnate levels (inverse normal transformed) according to milk intake stratified by the LCT-rs49883235 genotype in the HCHS/SOL. (F) Differences and 95% CIs in serum indolepropnate levels (inverse normal transformed) associated with one serving per day of milk intake according to the LCT-rs49883235 genotype in the HCHS/SOL and ARIC separately, and combined by meta-analysis.

