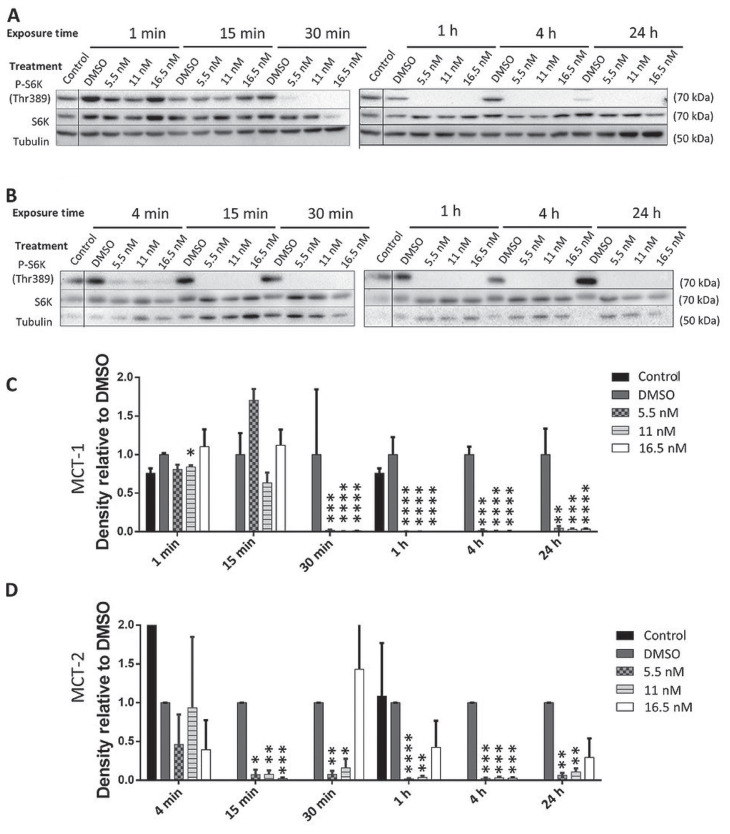
Figure 2.
Western blots of phosphorylated S6K (Thr389) in MCT-1 (A) and MCT-2 (B) lysates after exposure to rapamycin (RAPA). For the densitometry analysis of MCT-1 (C) and MCT-2 (D), the ratio of p-S6K:native S6K:tubulin was calculated for each treatment and normalized to the DMSO control for that time point.
n = 3 (*P ≤ 0.05, **P ≤ 0.01, ***P ≤ 0.001, ****P ≤ 0.0001). Error bars represent SEM.

