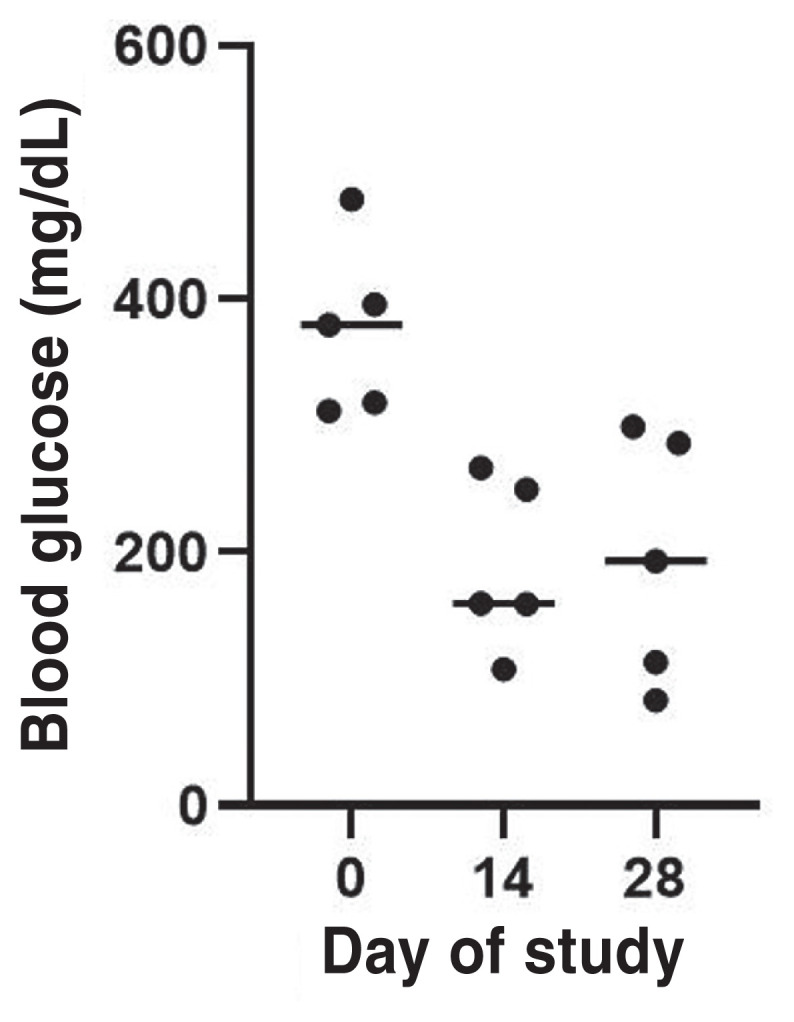
Figure 1.

Serial blood glucose concentrations of the blood glucose curves (BGCs) of diabetic cats (N = 5) before (Day 0) and after receiving oral bexagliflozin daily for 2 wk (Day 14) and 4 wk (Day 28) during the 4-week study period. Dots represent the mean blood glucose (MBG) concentration obtained from the 10-hour BGCs of each cat on Days 0, 14, and 28. Horizontal line represents median values of the MBG concentration obtained during the 10-hour BGC of all cats on Days 0, 14, and 28.
