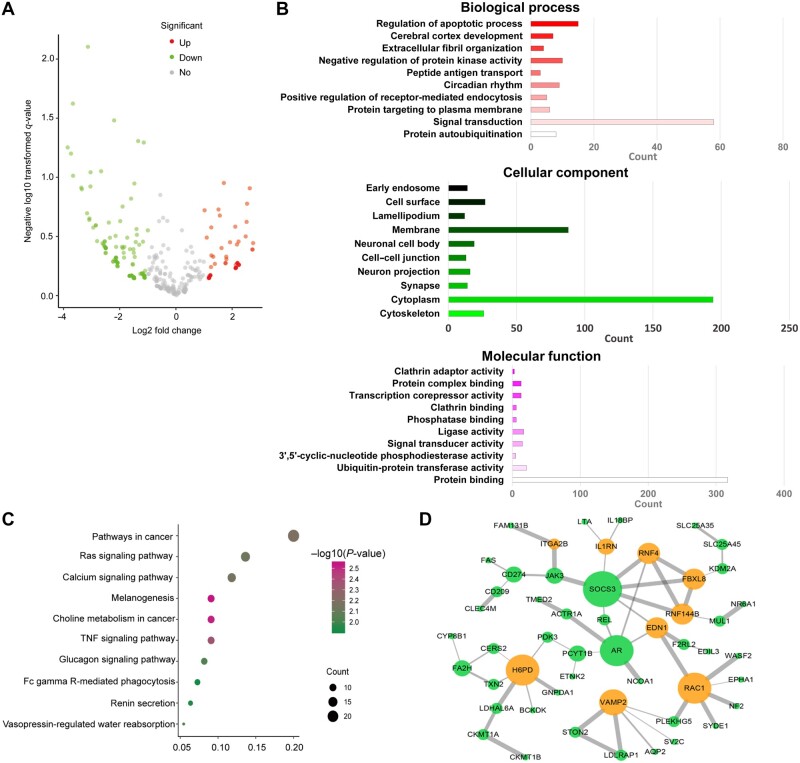
Figure 1.
GO, KEGG, and PPI network analyses for functional enrichment in B[a]P-treated HCC cells. RNA sequencing was performed on 7404 cells and 100 nM B[a]P-treated 7404 cells. (A) Volcano plot for differentially expressed mRNAs and miRNAs. (B) GO analysis of differentially expressed genes in categories of biological process, cellular component, and molecular function. (C) KEGG analysis of differentially expressed intersection mRNAs for 10 enriched main pathway terms. (D) PPI network organized by String and visualized by cytoscape 3.0, with orange and green spots representing up- and downregulated mRNA-encoded proteins, respectively. Both up- and downregulated mRNAs are significantly changed with FC ≥ 2.0, P < 0.05.

