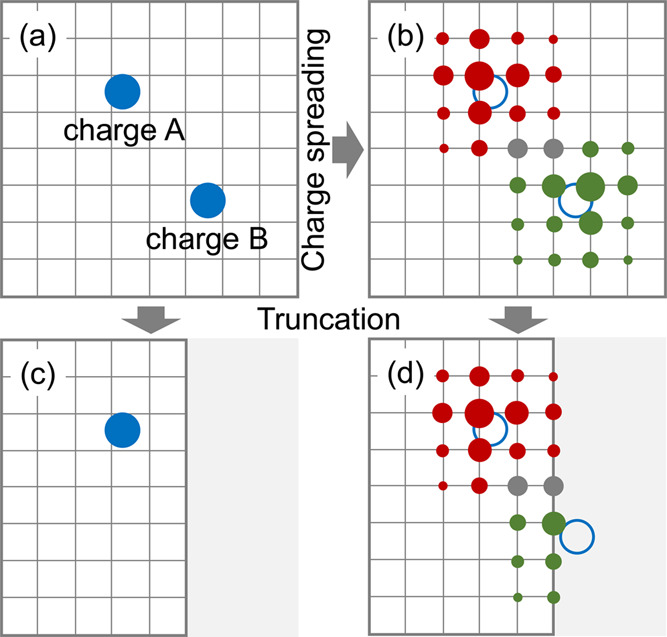
Figure 1.

Schematic diagram of spreading two identical atomic charges to a 2D grid. (a) Atomic charges A and B are represented by two blue solid circles. (b) B-spline interpolation algorithm is utilized to distribute charges A and B over the grid with an interpolation order of 4. Open circles indicate that charges A and B have been spread to the grid. Red and green solid circles represent the distributions of charges A and B, respectively, over the grid. The grid points with accumulated contributions by two charges are in gray. The radii of circles indicate the accumulated weights of atomic charges at grid points. The 2D grid is truncated in (c) and (d). Charge B is removed in (c), and the grid charges that belong to the truncated area (gray) are removed in (d).
