
Figure 6.
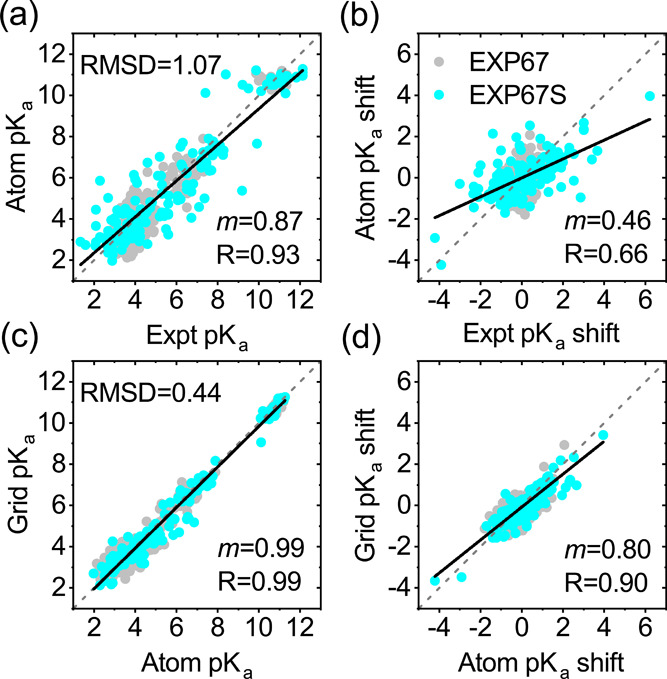
Comparison of the pKa’s and pKa shifts (a, b) from atomic charge-based DeepKa to the experiment and (c, d) from grid charge-based DeepKa to atomic charge-based DeepKa. The subset of EXP67, namely, test set EXP67S, is colored cyan. The diagonal (y = x) and linear regression lines are colored gray (dashed) and black (solid), respectively. The gray circles are data for the residues in EXP67. RMSD, regression slope (m), and R are displayed.