Figure 4.

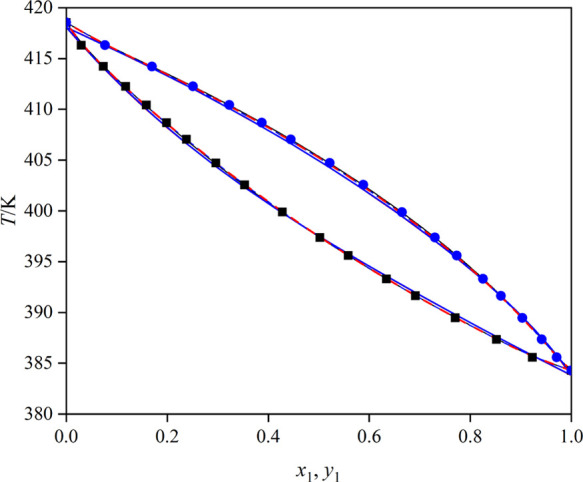
T–x–y curves for the mixture toluene (1) + butyl propanoate (2): blue ●, T–y (experimental); ■, T–x (experimental); red ---, UNIQUAC model; —, NRTL model; blue ---, Wilson model; red —, COSMO-UNIFAC model; and blue —, UNIFAC model.

T–x–y curves for the mixture toluene (1) + butyl propanoate (2): blue ●, T–y (experimental); ■, T–x (experimental); red ---, UNIQUAC model; —, NRTL model; blue ---, Wilson model; red —, COSMO-UNIFAC model; and blue —, UNIFAC model.