Figure 7.

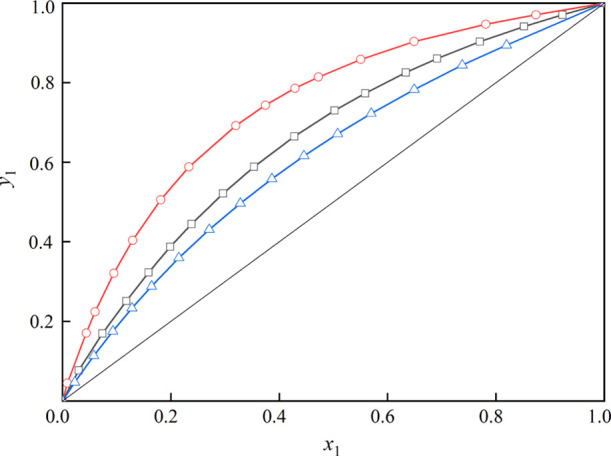
x–y curves of the mixtures: red -○-, toluene (1) + butyl butanoate (2); blue -△-, toluene (1) + triethylamine (2); and -□-, toluene (1) + butyl propanoate (2).

x–y curves of the mixtures: red -○-, toluene (1) + butyl butanoate (2); blue -△-, toluene (1) + triethylamine (2); and -□-, toluene (1) + butyl propanoate (2).