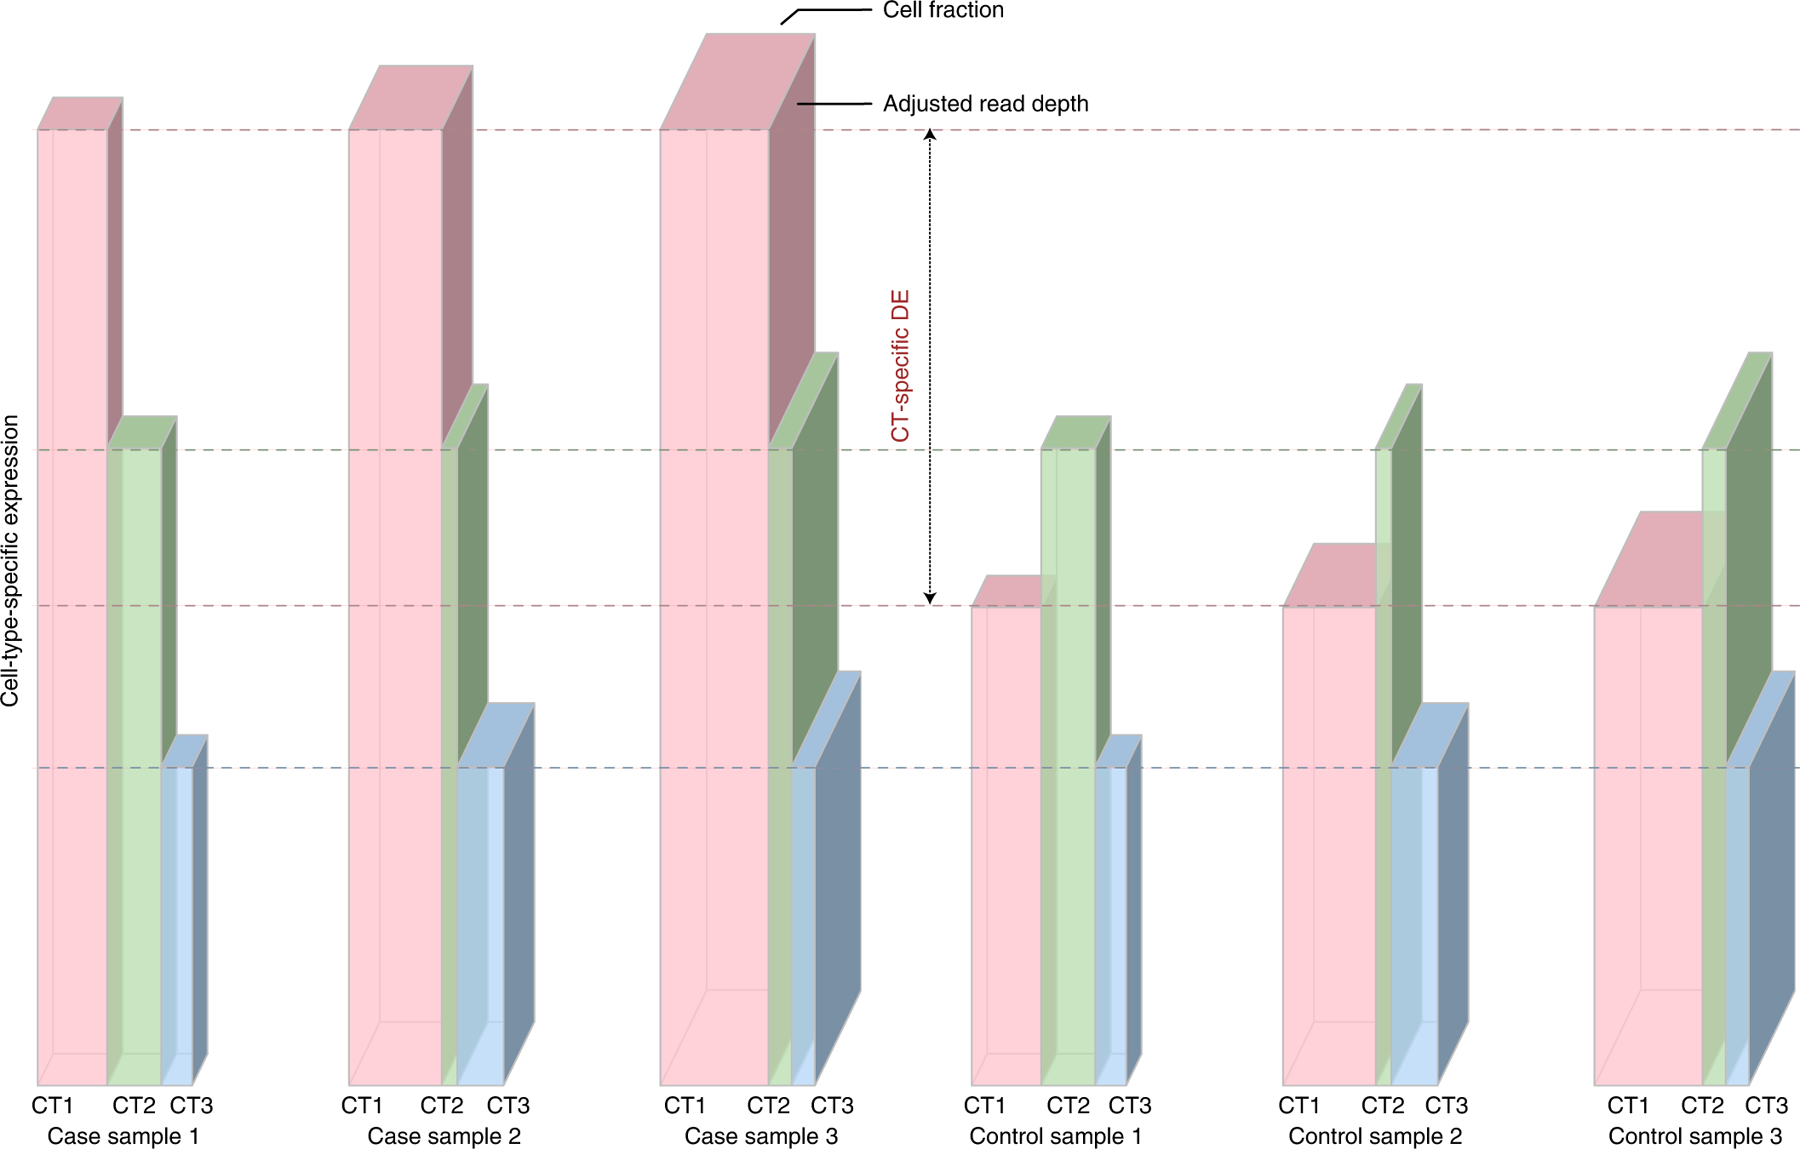
Figure 1:

Illustration of CT-specific expression
Each grouped bar illustrates the total expression of a gene in a bulk sample (the volume of the grouped bar) that is the summation of gene expression from individual cell types (each bar for a cell type). The depth of each grouped bar is proportional to the covariate-adjusted read-depth. The width of each bar is proportional to its cell fraction, and the height of each bar is proportional to the CT-specific expression. The left/right three columns show three case/control samples, respectively. Our method estimates the mean value of CT-specific expression for case and control groups separately. In this toy example, cell type 1 (pink) has twice expression in cases than controls, while cell type 2 (green) and cell type 3 (blue) are not differentially expressed.
