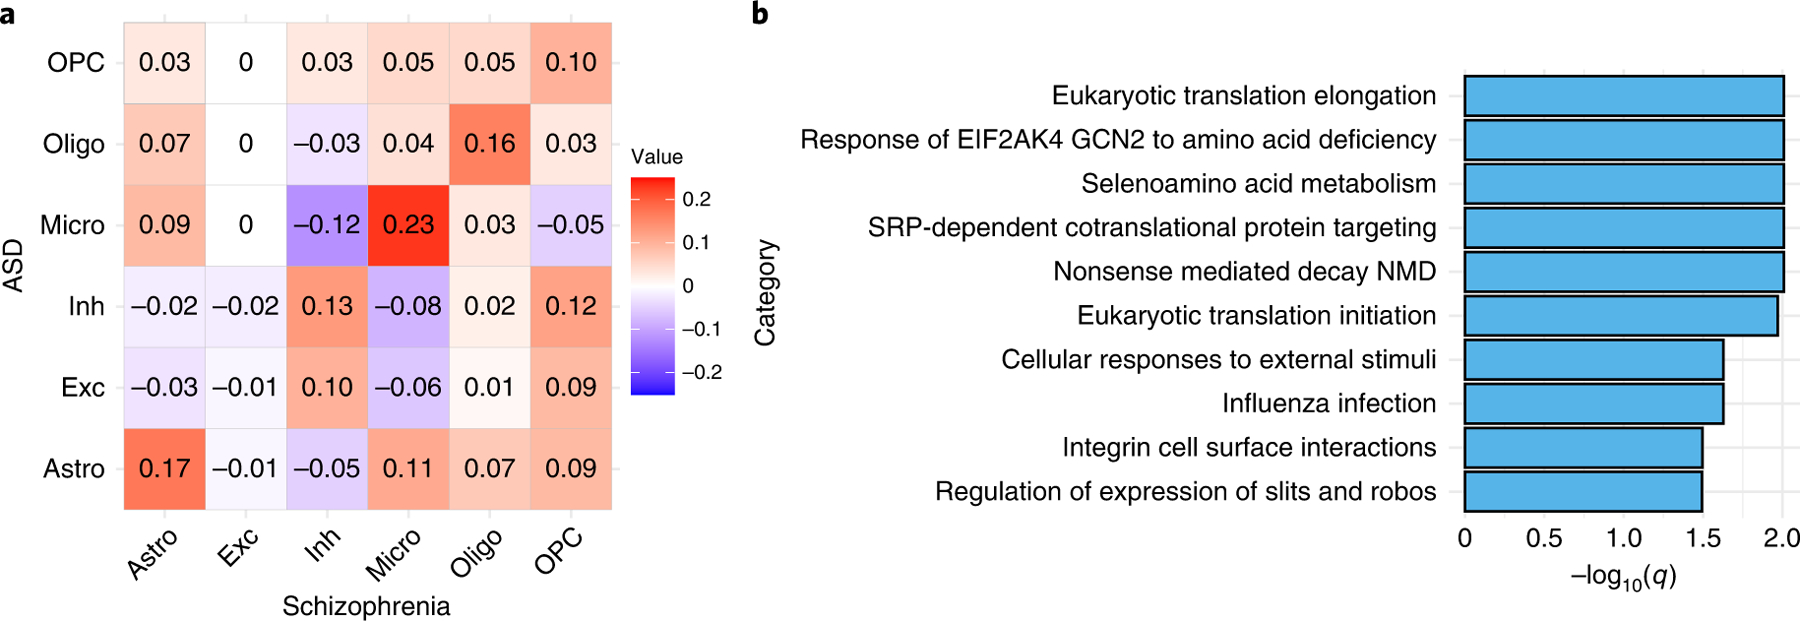
Figure 5:

Microglia-specific-DE signals
(A) The Spearman correlation matrix of −log10(Microglia-specific-DE p-values by CARseq) (calculated by CARseq) between CMC-SCZ and UCLA-ASD studies. (B) The REACTOME pathways that are over-represented by the 65 genes with microglia-specific-DE p-values smaller than 0.05 in both CMC-SCZ and UCLA-ASD studies. The q-values were calculated using R package “goseq” [35].
