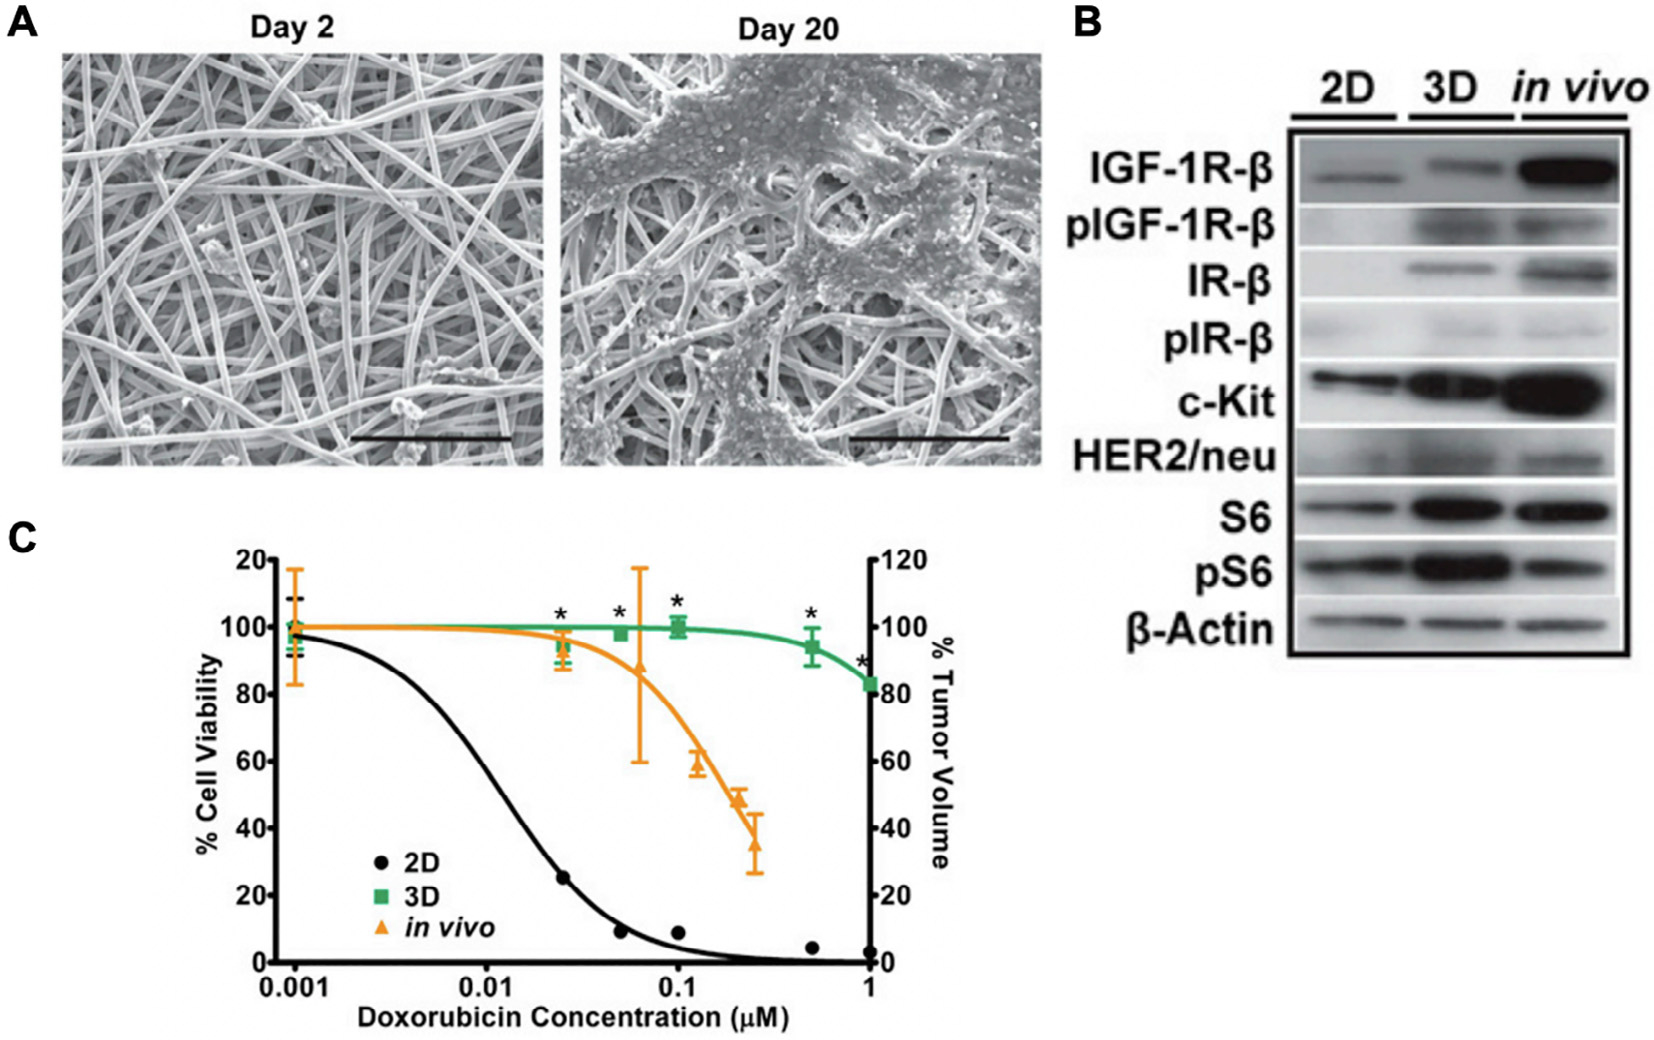
Fig. 2.

A 3D model of Ewing’s sarcoma (ES) using poly(ε-caprolactone) (PCL) scaffolds. (A) Scanning electron micrographs of ES cells in PCL scaffolds on day 2 and day 20. Scale bar: 200 μm. (B) Expression of IGF-1R/mTOR pathway-related proteins in ES cells cultured in 2D, 3D PCL scaffolds, and in vivo tumors. (C) ES cell dose response to doxorubicin therapy in 2D culture (black, IC50 = 0.0122 μM), 3D PCL scaffolds (green, IC50 = 2.738 μM), and in vivo (yellow, IC50 = 0.184 μM). Reproduced with permission from [39].
