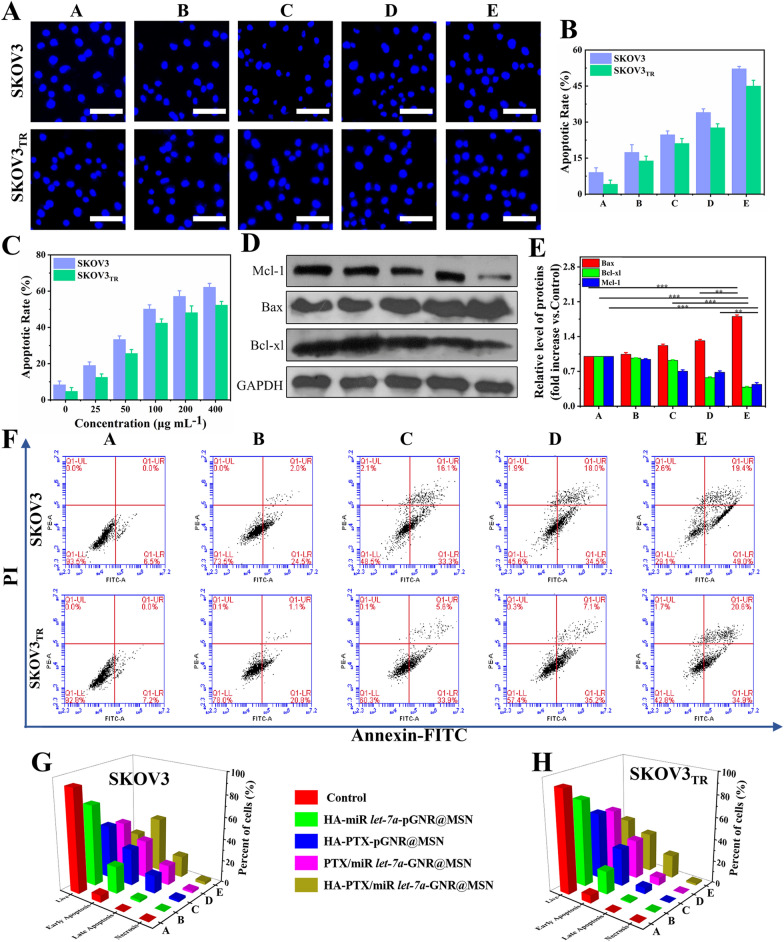
Fig. 5.
Apoptosis analysis of treated SKOV3 and SKOV3TR cells. A Fluorescence images using Hoechst H33258 staining and B corresponding quantitative analysis of apoptotic rate of SKOV3 and SKOV3TR cells treated with various therapeutic nanocomposites: A, control; B, HA-miR let-7a-pGNR@MSN; C, HA-PTX-pGNR @ MSN; D, PTX/miR let-7a pGNR@MSN; E, HA-PTX/miR let-7a-pGNR@MSN. Scale bar = 100 μm. C Analysis of apoptotic rate of SKOV3 and SKOV3TR cells treated with various concentrations of HA-PTX/miR let-7a-pGNR@MSN (0, 25, 50, 100, 200, and 400 μg/mL). D Western blotting of apoptosis-associated proteins in SKOV3TR cells treated with various therapeutic nanocomposites and E statistical analysis of relative protein levels: A, control; B, HA-miR let-7a-pGNR@MSN; C, HA-PTX-pGNR@MSN; D, PTX/miR let-7a pGNR@MSN; E, HA-PTX/miR let-7a-pGNR@MSN. F Flow cytometric analysis of apoptosis using annexin V-FITC/PI staining of SKOV3 and SKOV3TR cells after treatment with various therapeutic nanocomposites. A, control; B, HA-miR let-7a-pGNR@MSN; C, HA-PTX-pGNR@MSN; D, PTX/miR let-7a pGNR@MSN; E, HA-PTX/miR let-7a-pGNR@MSN. G, H Corresponding quantification analyses of the percentage of live, early apoptotic, late apoptotic, and necrotic cells after treatment of SKOV3 and SKOV3TR with various therapeutic nanocomposites: A, control; B, HA-miR let-7a-pGNR@MSN; C, HA-PTX-pGNR@MSN; D, PTX/miR let-7a-pGNR @MSN; E, HA-PTX/miR let-7a-pGNR@MSN. HA, hyaluronic acid; let-7a, lethal-7a; pGNR, polyethylene glycol-modified gold nanorod; MSN, mesoporous silica nanoparticle; PTX, paclitaxel; FITC, fluorescein isothiocyanate; PI, propidium iodide

