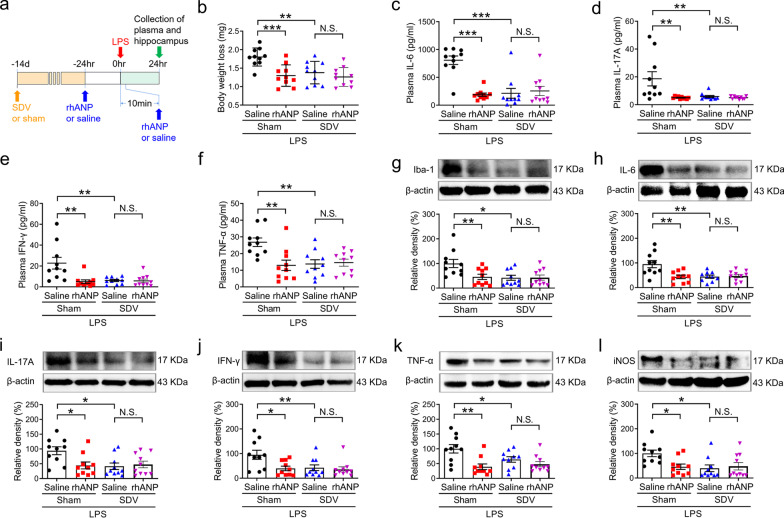
Fig. 3.
Roles of SDV in rhANP-mediated reduction of LPS-induced systemic inflammation and neuroinflammation. a Treatment schedule. Mice were intraperitoneally injected with lipopolysaccharides (LPS, 5 mg/kg). Recombinant human ANP (rhANP; 1.0 mg/kg) or 0.9% saline were intraperitoneally injected to mice at 24 h before and 10 min after LPS injection. Subdiaphragmatic vagotomy (SDV) was performed 14 days prior to LPS injection. Plasma and hippocampus were collected 24 h after LPS injection. b Body weight loss in each group (two-way ANOVA: rhANP: F1,36 = 7.058, P = 0.0117; SDV: F1,36 = 12.72, P = 0.0010; interaction: F1,36 = 4.923, P = 0.0329). The plasma levels of interleukin (IL)-6 (c; two-way ANOVA: rhANP: F1,36 = 13.07, P = 0.0009; SDV: F1,36 = 15.60, P = 0.0003; interaction: F1,36 = 20.51, P < 0.0001), IL-17A (d; two-way ANOVA: rhANP: F1,36 = 6.111, P = 0.0183; SDV: F1,36 = 7.794, P = 0.0083; interaction: F1,36 = 6.027, P = 0.0191), interferon (IFN)-γ (e; two-way ANOVA: rhANP: F1,36 = 6.460, P = 0.0155; SDV: F1,36 = 8.447, P = 0.0062; interaction: F1,36 = 7.836, P = 0.0082), and tumor necrosis factor (TNF)-α (f; two-way ANOVA: rhANP: F1,36 = 4.828, P = 0.0345; SDV: F1,36 = 6.217, P = 0.0174; interaction: F1,36 = 7.883, P = 0.0080). Western blot analysis of ionized calcium-binding adapter molecule 1 (iba-1) (g; two-way ANOVA: rhANP: F1,36 = 6.208, P = 0.0175; SDV: F1,36 = 4.772, P = 0.0355; interaction: F1,36 = 4.996, P = 0.0317), IL-6 (h; two-way ANOVA: rhANP: F1,36 = 6.286, P = 0.0168; SDV: F1,36 = 6.894, P = 0.0126; interaction: F1,36 = 8.569, P = 0.0059), IL-17A (i; two-way ANOVA: rhANP: F1,36 = 4.268, P = 0.0461; SDV: F1,36 = 3.363, P = 0.0750; interaction: F1,36 = 5.503, P = 0.0246), interferon (IFN)-γ (j; two-way ANOVA: rhANP: F1,36 = 4.706, P = 0.0367; SDV: F1,36 = 5.685, P = 0.0225; interaction: F1,36 = 3.530, P = 0.0684), TNF-α (k; two-way ANOVA: rhANP: F1,36 = 1.598, P = 0.2144; SDV: F1,36 = 12.72, P = 0.0010; interaction: F1,36 = 4.345, P = 0.0443), inducible nitric oxide synthase (iNOS) (l; two-way ANOVA: rhANP: F1,36 = 4.764, P = 0.0357; SDV: F1,36 = 2.933, P = 0.0954; interaction: F1,36 = 5.462, P = 0.0251) and their respective β-actin in the hippocampus. Data are shown as mean ± SEM, n = 10/group. *P < 0.05, **P < 0.01, ***P < 0.0001; N.S. not significant

