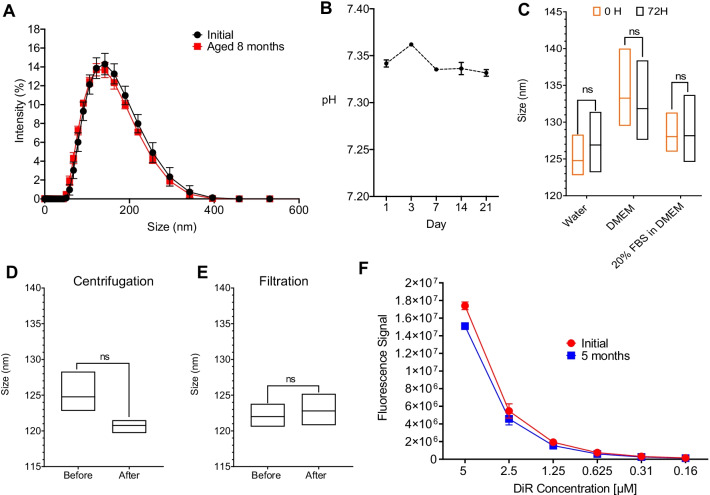
Fig. 2.
Macrophage targeted two-color (DiI/DiR) fluorescent nanoemulsion. A PBS-based PFC-NE particle size distribution overlay comparison between day 1 and 8 months after manufacturing. B pH stability of PFC-NE measured upon manufacture and up to 21 days. C PFC-NE serum stability in three different biological media (Water, DMEM, and 20% FBS in DMEM) was measured at time 0 and after 72 h incubation at elevated temperature of 37 °C (p = 0.514, p = 0.777, p = 0.969 respectively, Student’s T-test, n = 3). D PFC-NE centrifugation stability was conducted with 3000 rpm for 30 min. PFC-NE (undiluted) size was measured before and after centrifugation (p = 0.097, Student’s T-test, for n = 3). E PFC-NE stability was tested and analyzed before and after sterile-filtration with a 0.22 μm MCE membrane filter. All particle size and/or distribution were measured by Dynamic light scattering (DLS) (p = 0.642, Student’s T-test, n = 3). F Fluorescence signals of the PFC-NE with NIRF dye DiR were compared between week 1 and week 20 after manufacturing. PFC-NE was diluted at PFC-NE to water ratio of 1:4. The fluorescence signal was collected by LI-COR Odyssey Imager. Error bar represents the standard deviation from three independent measurements

