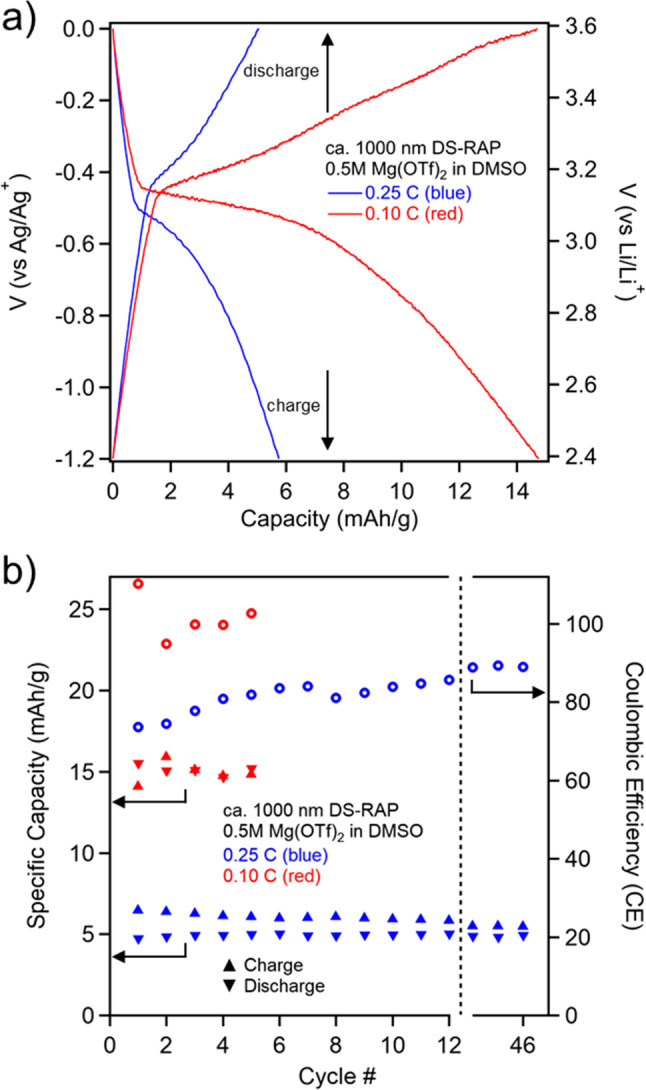
Figure 4.

Galvanostatic cycling (GC) of the smaller DS-RAP (ca. 1000 nm) at a C-rate of 0.10 and 0.25 C. (a) Charge/discharge curves (cycle 3 for 0.10 C and cycle 46 for 0.25 C). Potential (V) vs Li/Li+ is converted from Ag/Ag+. (b) Charge/discharge cycling stability and Coulombic efficiency (CE) data. The reported GC experiments were performed using DMSO with 0.5 M Mg(OTf)2. Additional GC results are shown in the Supporting Information (Figure S6).
