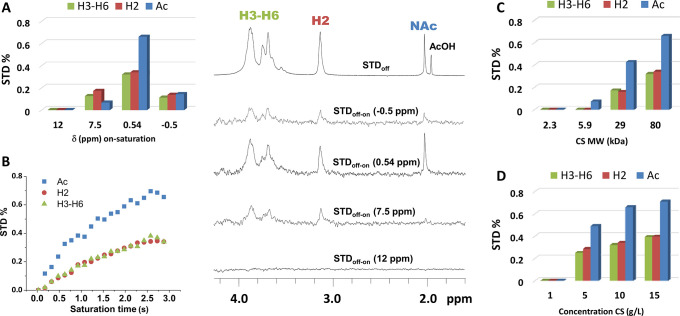
Figure 2.
Central panel: IF-STD spectra (750 MHz, 298 K, tsat 3 s, BW 130 Hz) of CS (80 kDa, DA 14, 10 g/L in pD 4.5 acetate buffer). STDoff-on (×100) with on-saturation at −0.5, 0.54, 7.5, and 12 ppm. Left panel: STD factor as a function of the on-saturation ppm (A) and tsat (on-saturation at 0.54 ppm, B). Right panel: STD factor (on-saturation at 0.54 ppm) as a function of the MW (C) and concentration of CS (D). Note that “H3–H6” includes all H3–H6 plus H2 of N-acetyl glucosamine, while “H2” refers to H2 of glucosamine. Interestingly, IF-STD spectra lack the residual nondeuterated signal of the acetate buffer as it does not interact with the IF.

