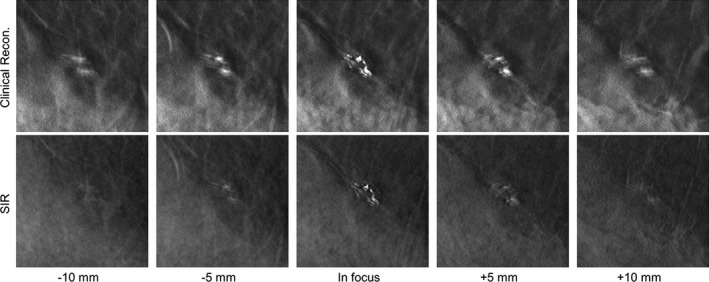
Figure 5.

A cluster of calcifications in a clinical DBT exam reconstructed with the clinical reconstruction engine (top) and SIR (bottom) is shown in focus (middle image column) and at locations above (left two image columns) and below (right two image columns) the focal plane in the z direction. All image shown with the same W/L.
