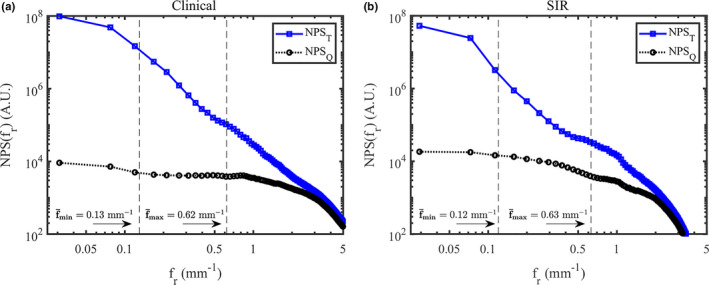
Figure 9.

The total and quantum NPS in the anthropomorphic breast phantom using the clinical reconstruction method (a) and SIR (b). The average upper and lower frequency limits used for the power‐law fitting in the clinical cohort are shown in this figure. [Color figure can be viewed at wileyonlinelibrary.com]
