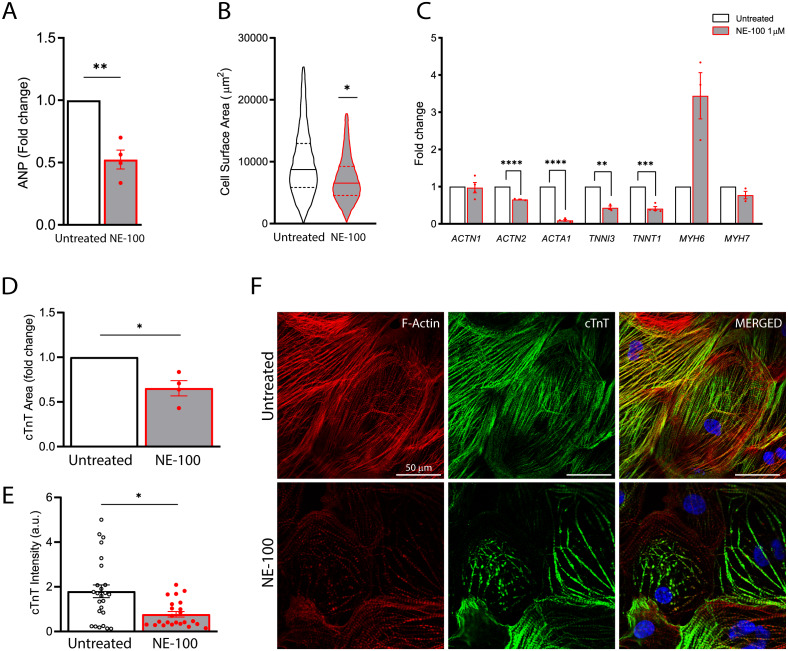
Figure 5. S1R inhibition downregulates the expression of structural-related genes and compromise cytoskeletal integrity.
(A) Real-time qPCR shows decreased levels of transcript content for ANP after S1R inhibition (N = 4). (B) Cell area was quantified by F-actin staining and shows a significant decrease in cell body sizes after exposure to NE-100 for 48 h. Data represents distribution of surface area measured from approximately 24000 cells in four independent experiments (N = 4). (C) Changes in myofibril and cytoskeletal-related gene expression after 24 h of NE-100 1 µM exposure from at least three replicates obtained from independent experiments (N = 3 or N = 4). (D and E) Quantification of cTnT immunoreactive area and intensity, normalized by the total number of cells per field; values are expressed relative to untreated controls (D) or arbitrary units, and data points represent mean cTnT intensity per well (E) (N = 4). (F) Representative confocal images show in more detail the disruption of F-actin and cTnT organization, observed in at least four independent repeats (N = 4). Scale bar = 50 µm. Data are presented as the average ± S.E.M, statistical differences were analyzed by unpaired Welch’s t-test (p = 0.0081 and p = 0.0262) (A and D), nested t-test (p = 0.0108) (B), multiple t-tests (Holm-Sidak method) (ACTN1 p = 0.8478, ACTN2 p = 0.000004, ACTA1 p < 0.000001, TNNI3 p = 0.0011, TNNT1 p = 0.0001, MYH6 p = 0.0502, MYH7 p = 0.1582) (C), and Mann–Whitney test (p = 0.0235) (E). Data points represent independent experiments unless otherwise stated. * p < 0.05; ** p < 0.01; *** p < 0.001; **** p < 0.0001.

