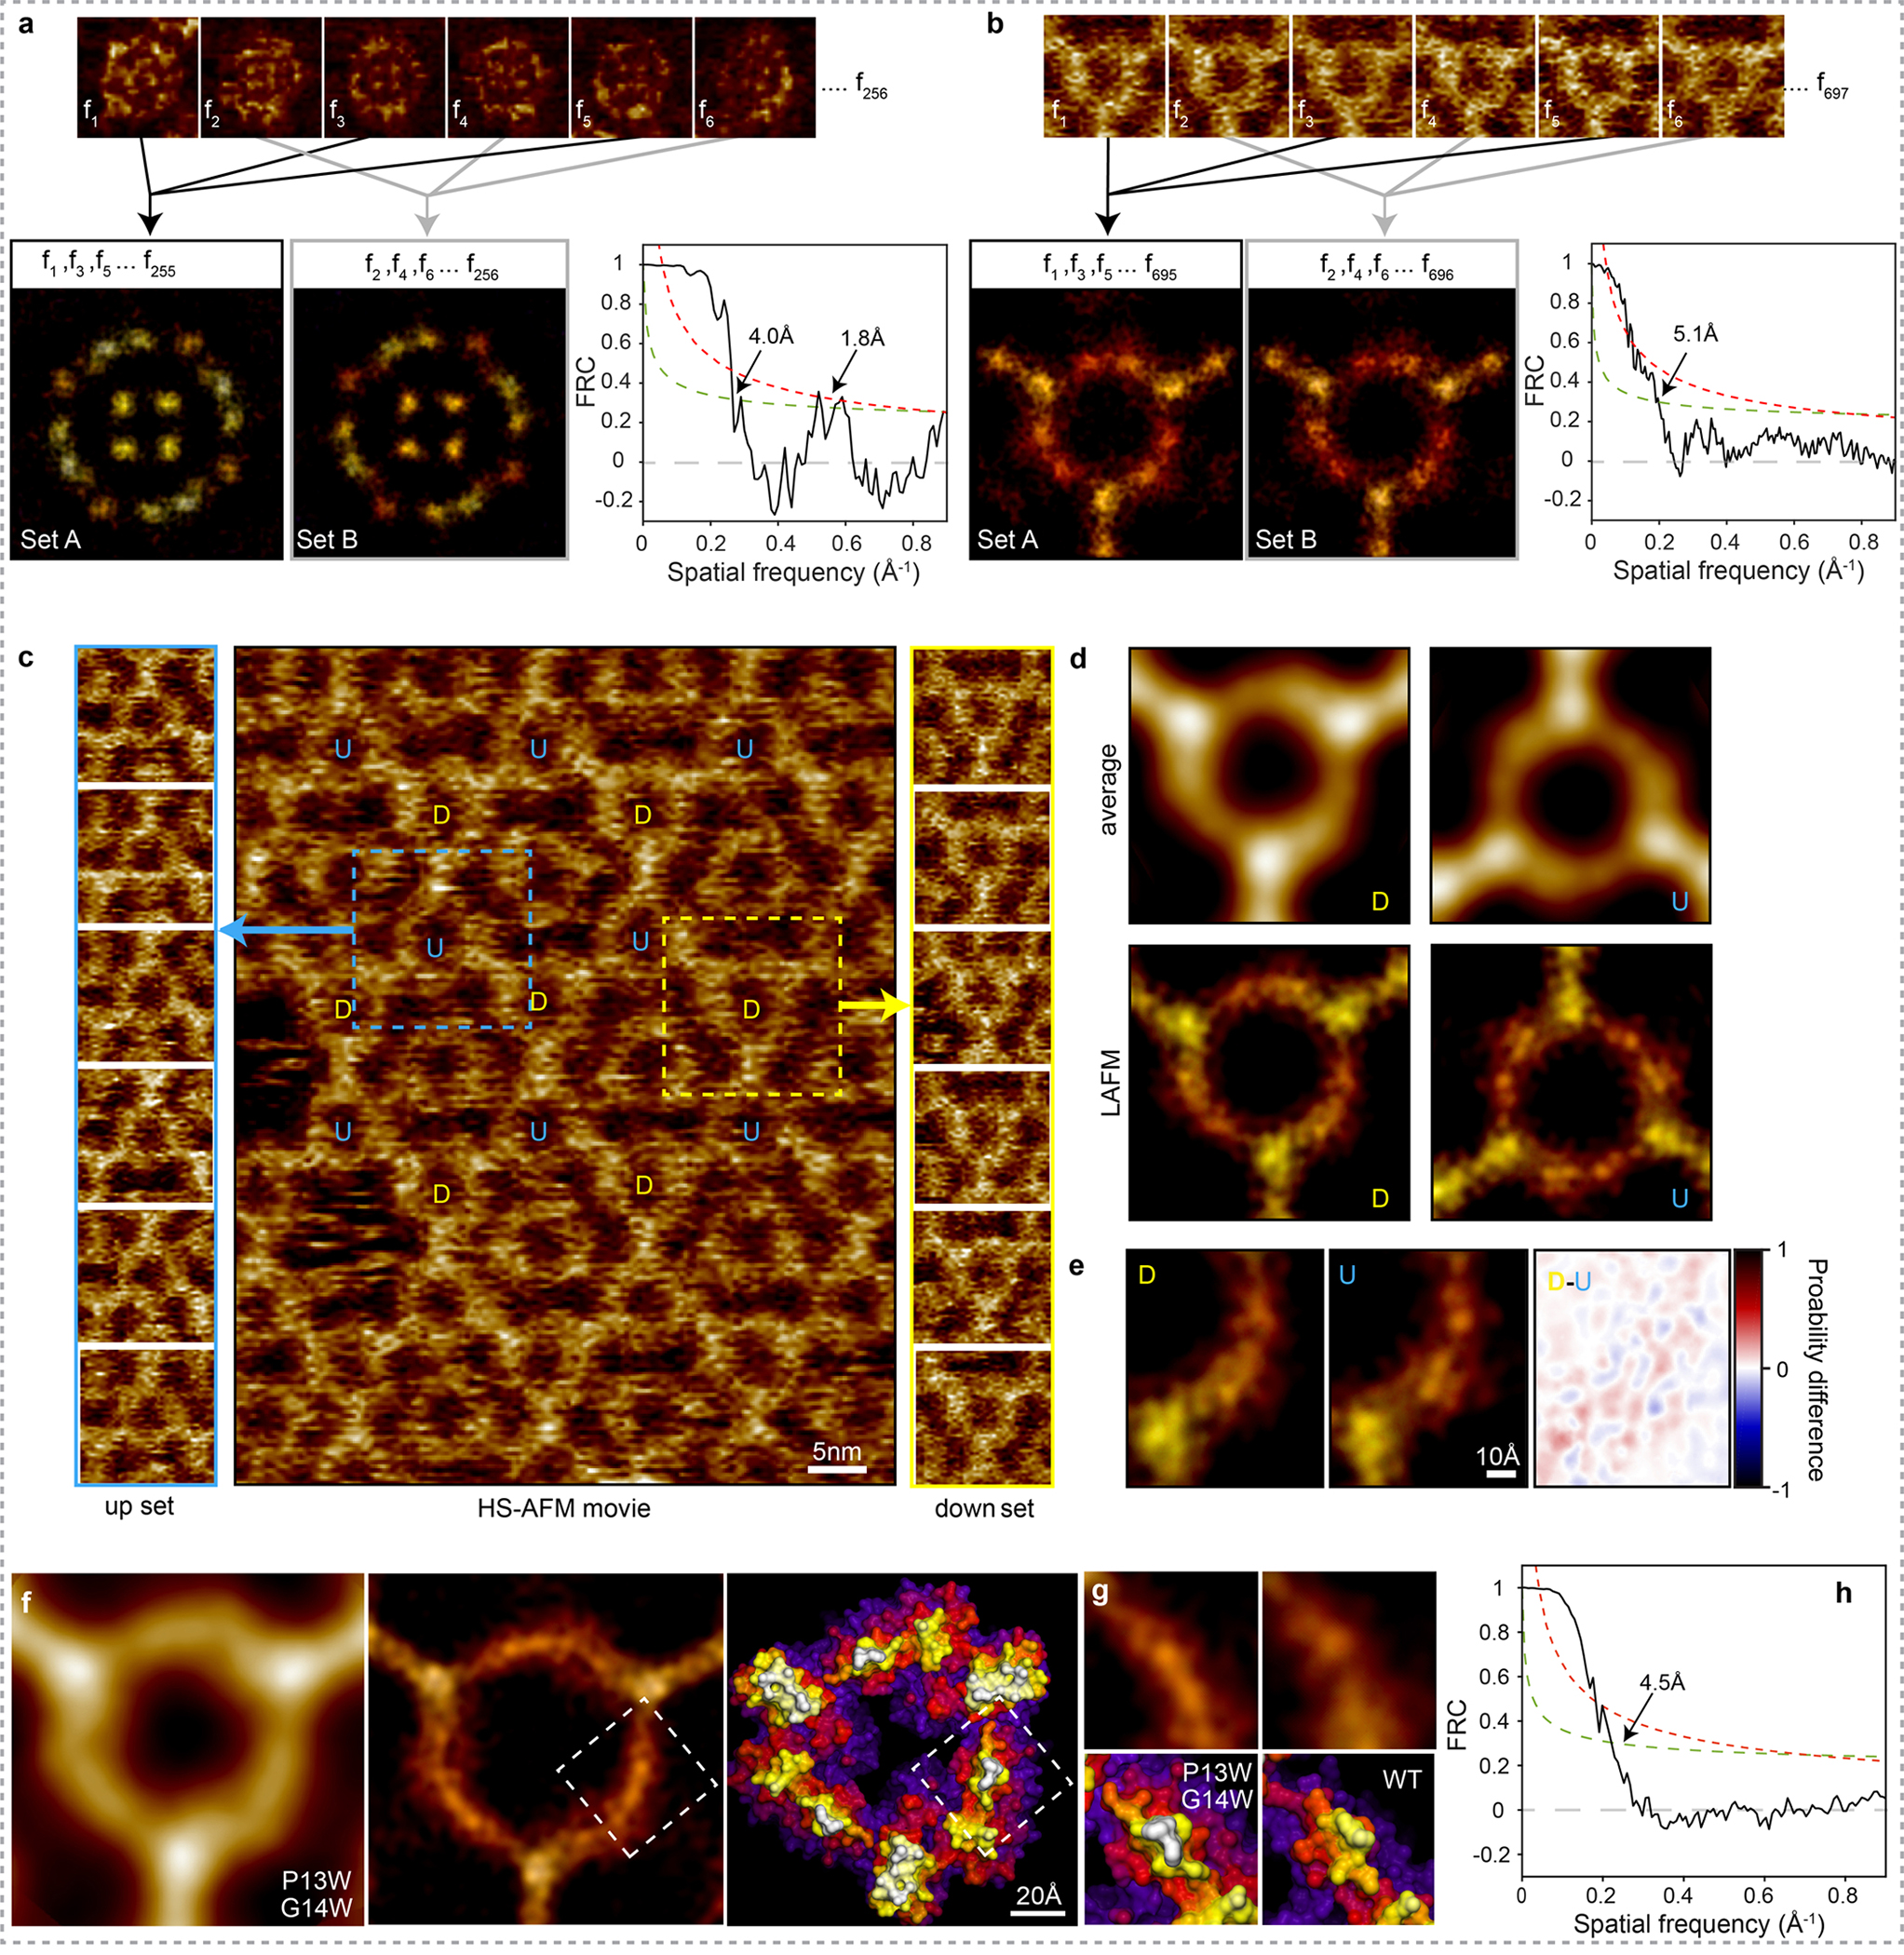
Extended Data Figure 7|. Localization AFM (LAFM) map resolution and quality assessment.

AFM Image frames of AqpZ (a) and A5 (b) are alternately extracted into two separate image sets (Set A and Set B). The localization AFM algorithm is then applied to each image set to produce two independent LAFM half-maps of AqpZ (left) and A5 (right). Fourier Ring Correlation (FRC) analysis of the LAFM half-maps is then used for quantification of the power as a function of the spatial resolution in the AqpZ dataset (left) and A5 (right). Dashed and dotted lines show the 1/2-bit and 3σ criteria respectively. c) Image from a HS-AFM movie of A5 in a p6 lattice (center) showing that the A5 lattice contains trimers of two fixed orientations labeled U and D. The two A5 trimer types U and D are scanned with different relative orientation with respect to the HS-AFM fast-scan axis. Extracted images of the trimers in each of the two orientations are shown either side for set U (up; left) and set D (down; right). d) Average AFM and LAFM maps filtered to 5Å of A5 trimers in the U (n = 700) and D (n = 697) orientations. e) Structural comparison between LAFM maps obtained from the independent differently orientated A5 and the probability difference map (Image U has been rotated 180o to allow direct comparison). f) Analysis of A5 P13W-G14W mutant (data acquisition: A5 P13W-G14W on a DOPC/DOPS (1/1) bilayer imaged by HS-AFM in amplitude modulation mode: Scan speed: 1 frame/s, scan area: 120nm, image size: 300pixel, pixel sampling: 4.0Å/p). Average AFM map (left), LAFM map (middle; pixel sampling: 0.5Å/p, number of particles: n = 300, filtered to 4.5Å) and surface representations of a A5 P13W-G14W structural model. g) Detail views of the LAFM maps (top), and structures (bottom; MD-refined structural model of A5 P13W-G14W and X-ray structure of A5). The mutations appear to induce conformational rearrangements in the N-terminal region (residues 1 to15), with an increased height and peaking-probability at positions 13–14 in the LAFM map. h) FRC analysis of the LAFM map.
