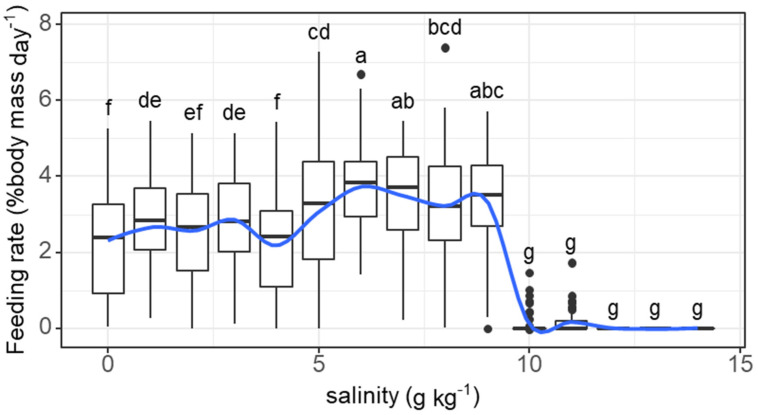
Figure 1.
Variations in the feeding rate (% body mass day−1) of grass carp with daily increasing salinity (g kg−1). The data are expressed as boxplots, with boxes indicating the upper, middle, and lower quartiles, and vertical lines indicating the upper whisker and lower whisker. The blue curve describes the changing tendency using locally weighted scatterplot smoothing (LOWESS). a–g: Boxes without common superscripts indicate significant differences among salinities (p < 0.05). Black dot: the outliers.

