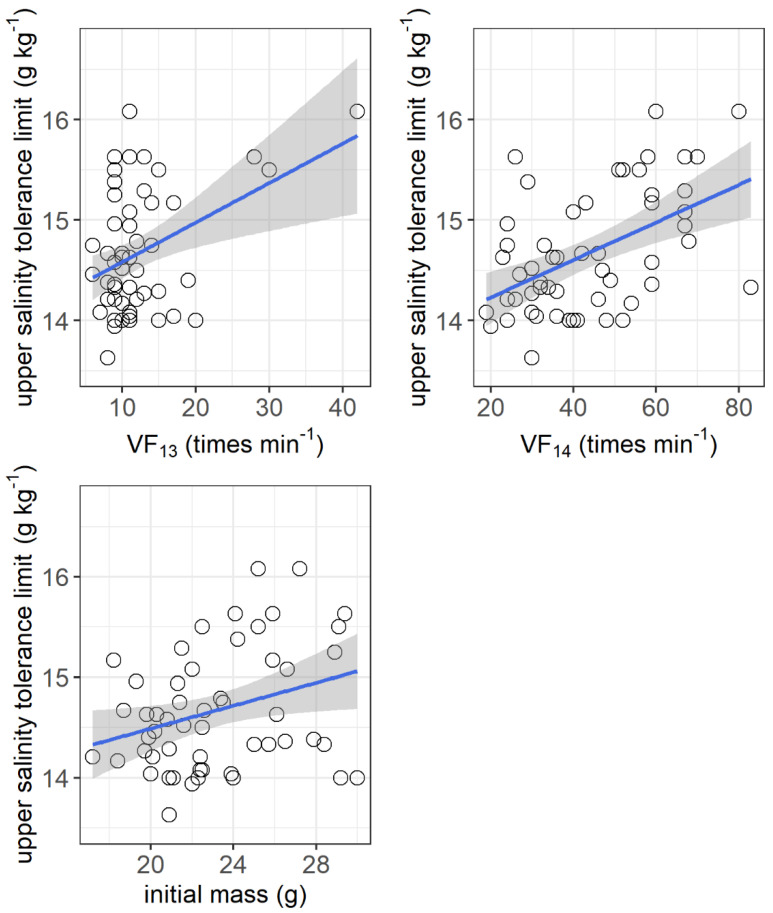
Figure 5.
Correlations between upper salinity tolerance limit (g kg−1) and ventilation frequency at salinities of 13 g kg−1 (VF13, times min−1) and 14 g kg−1 (VF14, times min−1) and initial body mass (g) of grass carp. VF13: r2 = 0.155, p = 0.0032; VF14: r2 = 0.253, p = 0.003; initial mass: r2 = 0.092, p = 0.026. The data are shown by the circles and the regressions are shown by the blue line.

