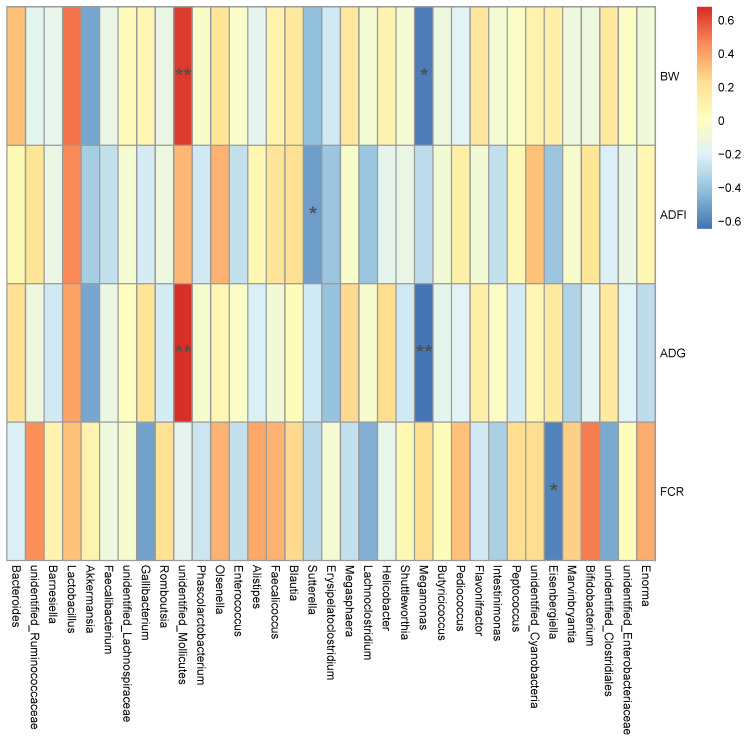
Figure 5.
The Spearman correlation analysis of cecal microbial species at genus level with growth performance of yellow-feathered broilers. Spearman correlation coefficients are represented by color ranging from red, positive correlation (0.6), to blue, negative correlation (−0.6). * indicates statistically significant difference (p < 0.05). ** indicates extremely significant difference (p < 0.01). Abbreviations: BW, body weight; ADFI, average daily feed intake; ADG, average daily gain; FCR, feed conversion ratio.

