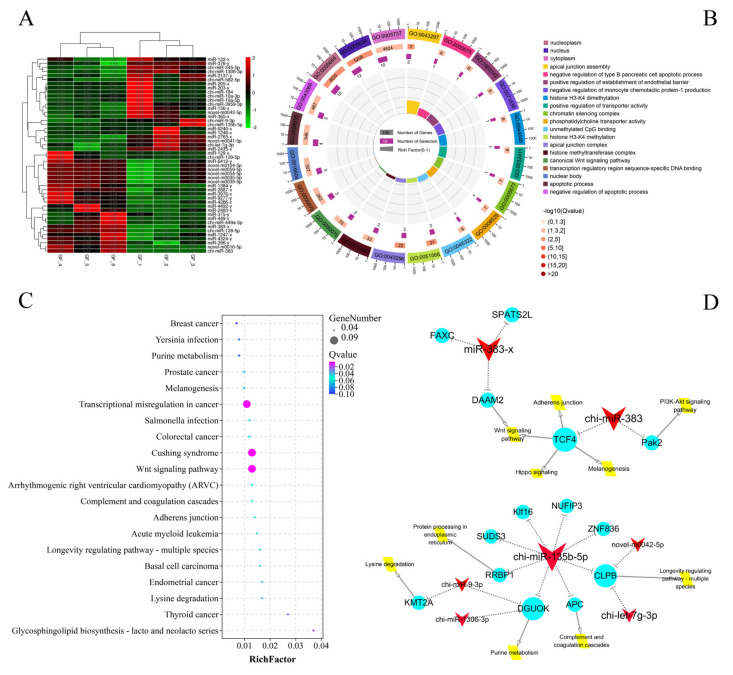
Figure 2.
Functional analysis DEmiRNAs between LFs and SFs of Dazu black goats: (A), clustering heat map of 49 DEmiRNAs; red represents up-regulated expression and green represents down-regulated expression; (B), top 20 terms of GO enrichment analysis; (C), top 20 pathways of KEGG enrichment analysis; and (D), key miRNA regulation network in DEmiRNAs between LFs and SFs of Dazu black goats; red represents DEmiRNAs, blue represents DEmRNAs, and yellow represents the major pathways; the size represents the number of DEmiRNA-TGs, i.e., a larger size means greater number of DEmiRNA-TGs.

