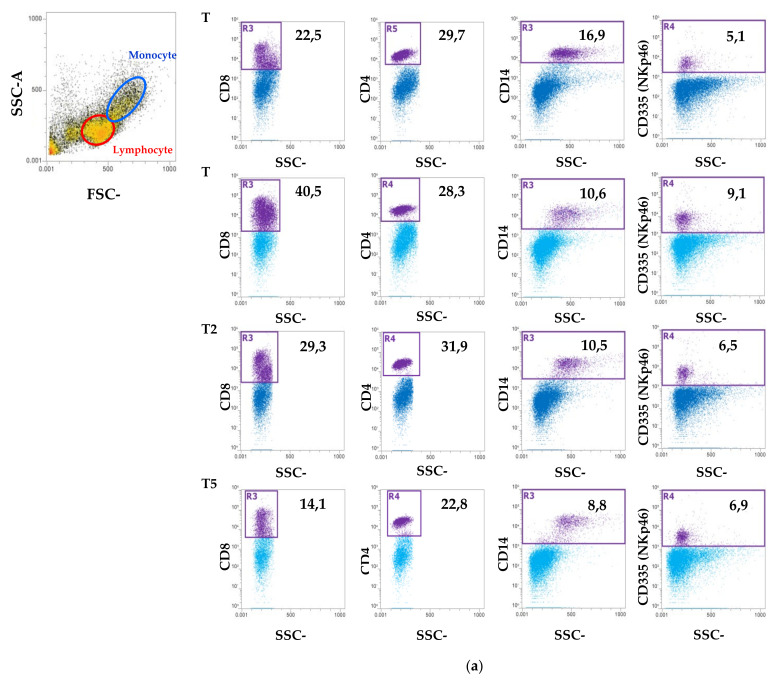
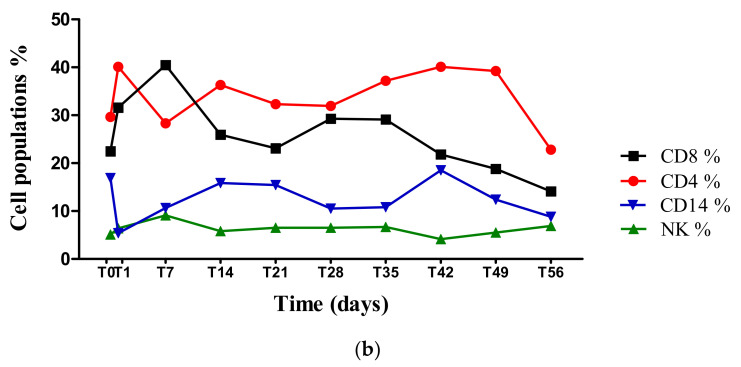
Figure 5.
Flow cytometric analysis of immune cells population in PBMCs. (a) Representative dot plots showing the selection of lymphocytes and monocytes based on their SSC/FSC properties and the percentage of CD4+, CD8+, CD14+ and CD335+ (NK) cells at T0 (the day of the arrival at the Department of Veterinary Medicine), T1, T28 and T56. (b) Line plot that shows the trend of the CD4+, CD8+, CD14+ and CD335+ (NK) cell populations (%) at different time points from T0 to T56.


